
Several years of mixed results forced a fresh look at my testing, programming, and training decisions. Pretty much all athletes were getting stronger in the gym, and most were improving their jump heights. But only some improved their speed.
That raised a few questions.
How can an athlete improving their maximum strength have no impact on their jump height or speed? Were they non-responders to strength and speed training, or was I giving them an inappropriate stimulus?
How can we optimise the potential for transfer from the gym to pitch? And what clues do faster players leave behind in terms of their strength characteristics?
Why CMJ is worth profiling and improving
When most coaches go through their own data, they’ll find strong relationships between athletes’ vertical jump and linear sprint performance.
The 2017 NFL combine data set reveals strong linear relationships between the standing vertical and 40-yard dash time (R2 = 0.56), with a moderate relationship between the vertical jump and 5-10-5 shuttle. [1]
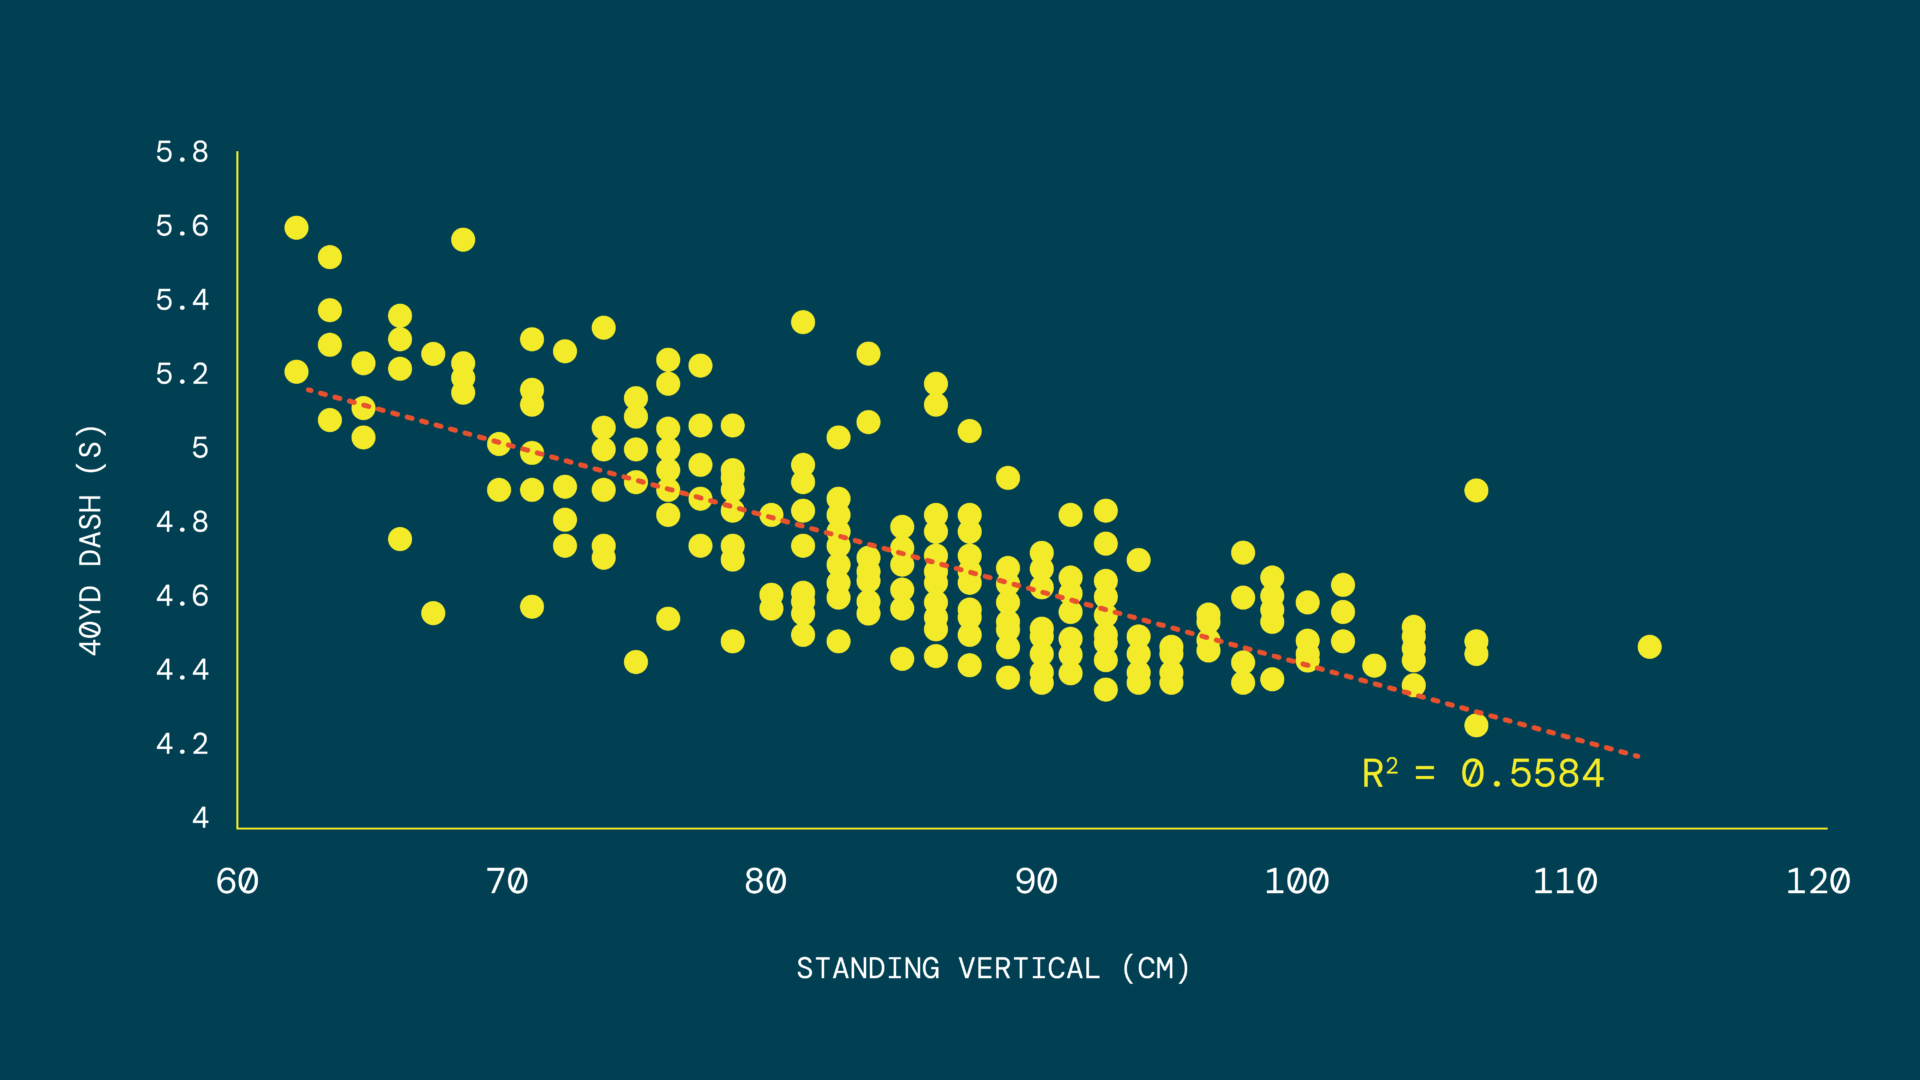
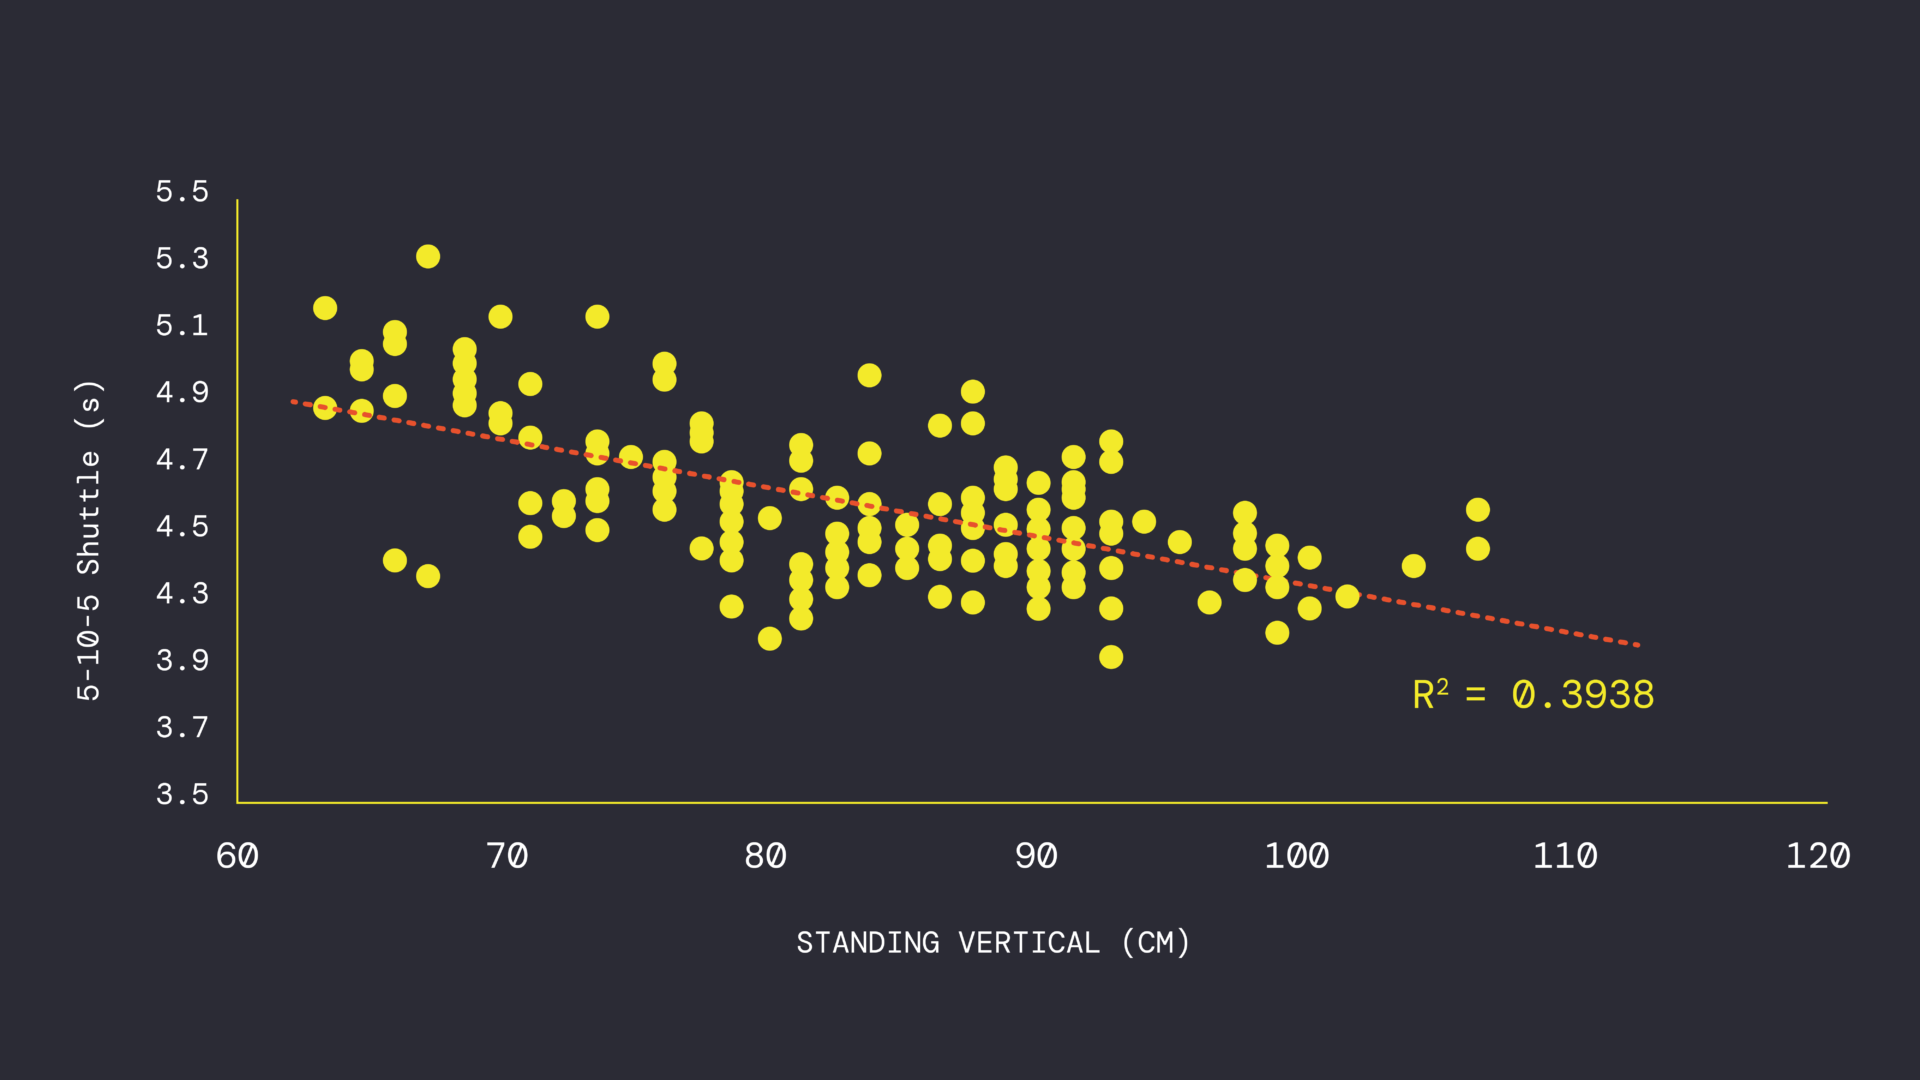
Years of data from my programmes show strong relationships between acceleration (0-10 meter performance) and countermovement jump height. Countermovement jump height explains 50% of the variance in acceleration performance. This makes sense, given the shared characteristics that benefit both jumping and running fast: hip extension force, rate of force development, and stiffness qualities.
Countermovement jump is the strongest predictor of multidirectional speed performance. Reactive strength index, for example, typically explains around 10% of variance in acceleration and maximum velocity performance.
Overall CMJ height, rather than specific metrics from within the phases in the jump, is the most important separator between players with good vs. poor braking ability. [2]
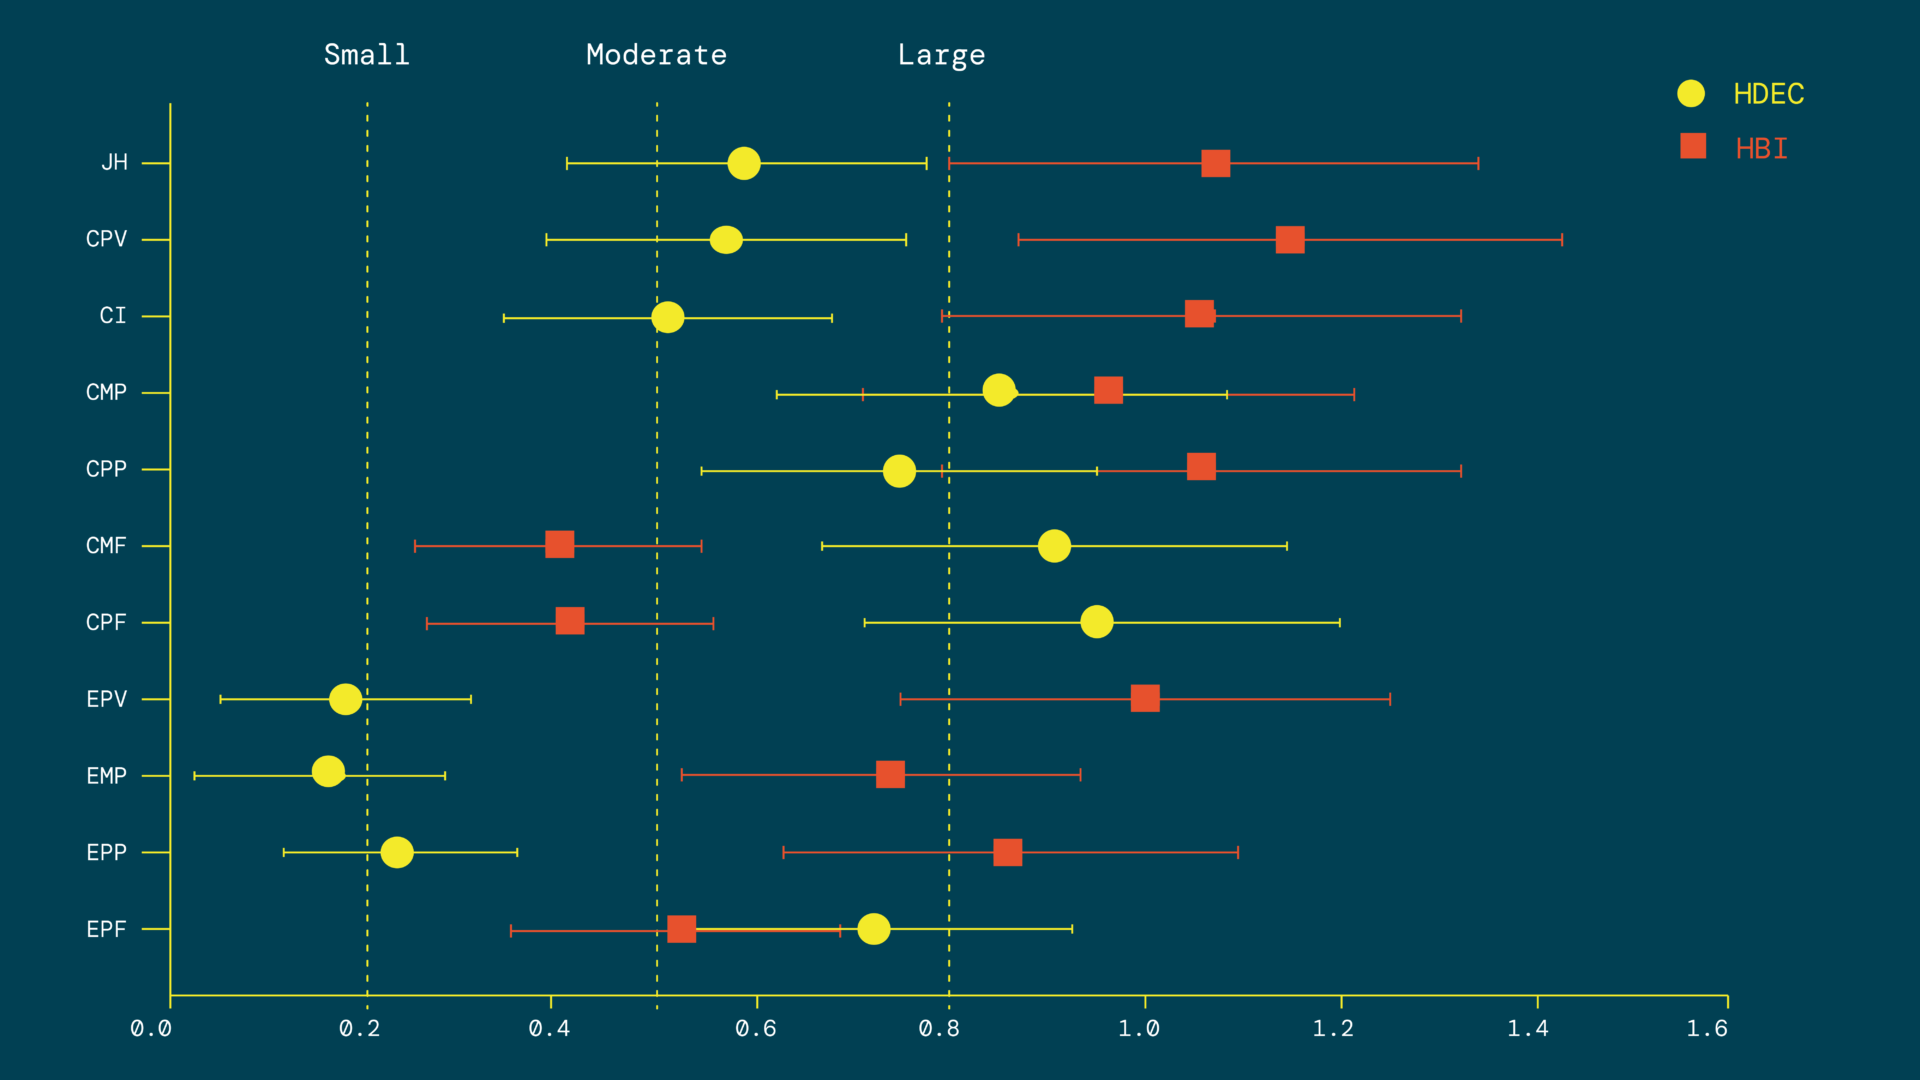
No particular jump strategy or metric appears to be associated with effective brakes, but overall jump height has some association.
These relationships become weaker, although still prominent, as we extend the distance and variability in the task. Table 1 summarises some relationships between CMJ height—assessed with the hands on the hips—and various measures of speed performance across different populations.
| 0-10 m split time | 10-20 m split time | Max velocity | |
| Explained variance | 50% | 27% | 24 – 27% |
| Association strength | Strong | Moderate | Moderate |
This data shows that CMJ performance better explains linear speed performance over short distances compared to longer distances.
Other factors may play a larger role as distances extend, with a shift from muscular “pushing” to tendon “bouncing” and a significant reduction in ground contact time. There are also technical factors that can contribute to performance over longer distances, as there are more complex steps and ground contacts. These drive home the point that strong and powerful doesn’t automatically equal fast.
However, we can confidently assume that improving CMJ height will transfer to improving factors that can benefit an athlete’s speed.
Tweet ThisYears of data from my programmes show strong relationships between acceleration (0-10 meter performance) and countermovement jump height. Countermovement jump height explains 50% of the variance in acceleration performance.
@TommyMunday1
Profiling the jump to establish programming decisions
Jump profiling measures can establish how an athlete achieves a given jump height. This can inform training prescriptions for improving CMJ height.
Output Sports or VALD ForceDecks are useful for performing different assessments under different constraints.
The pictures in Figure 4 show three different CMJ strategies, depths, and ranges to achieve jump heights within ~10% of each other.
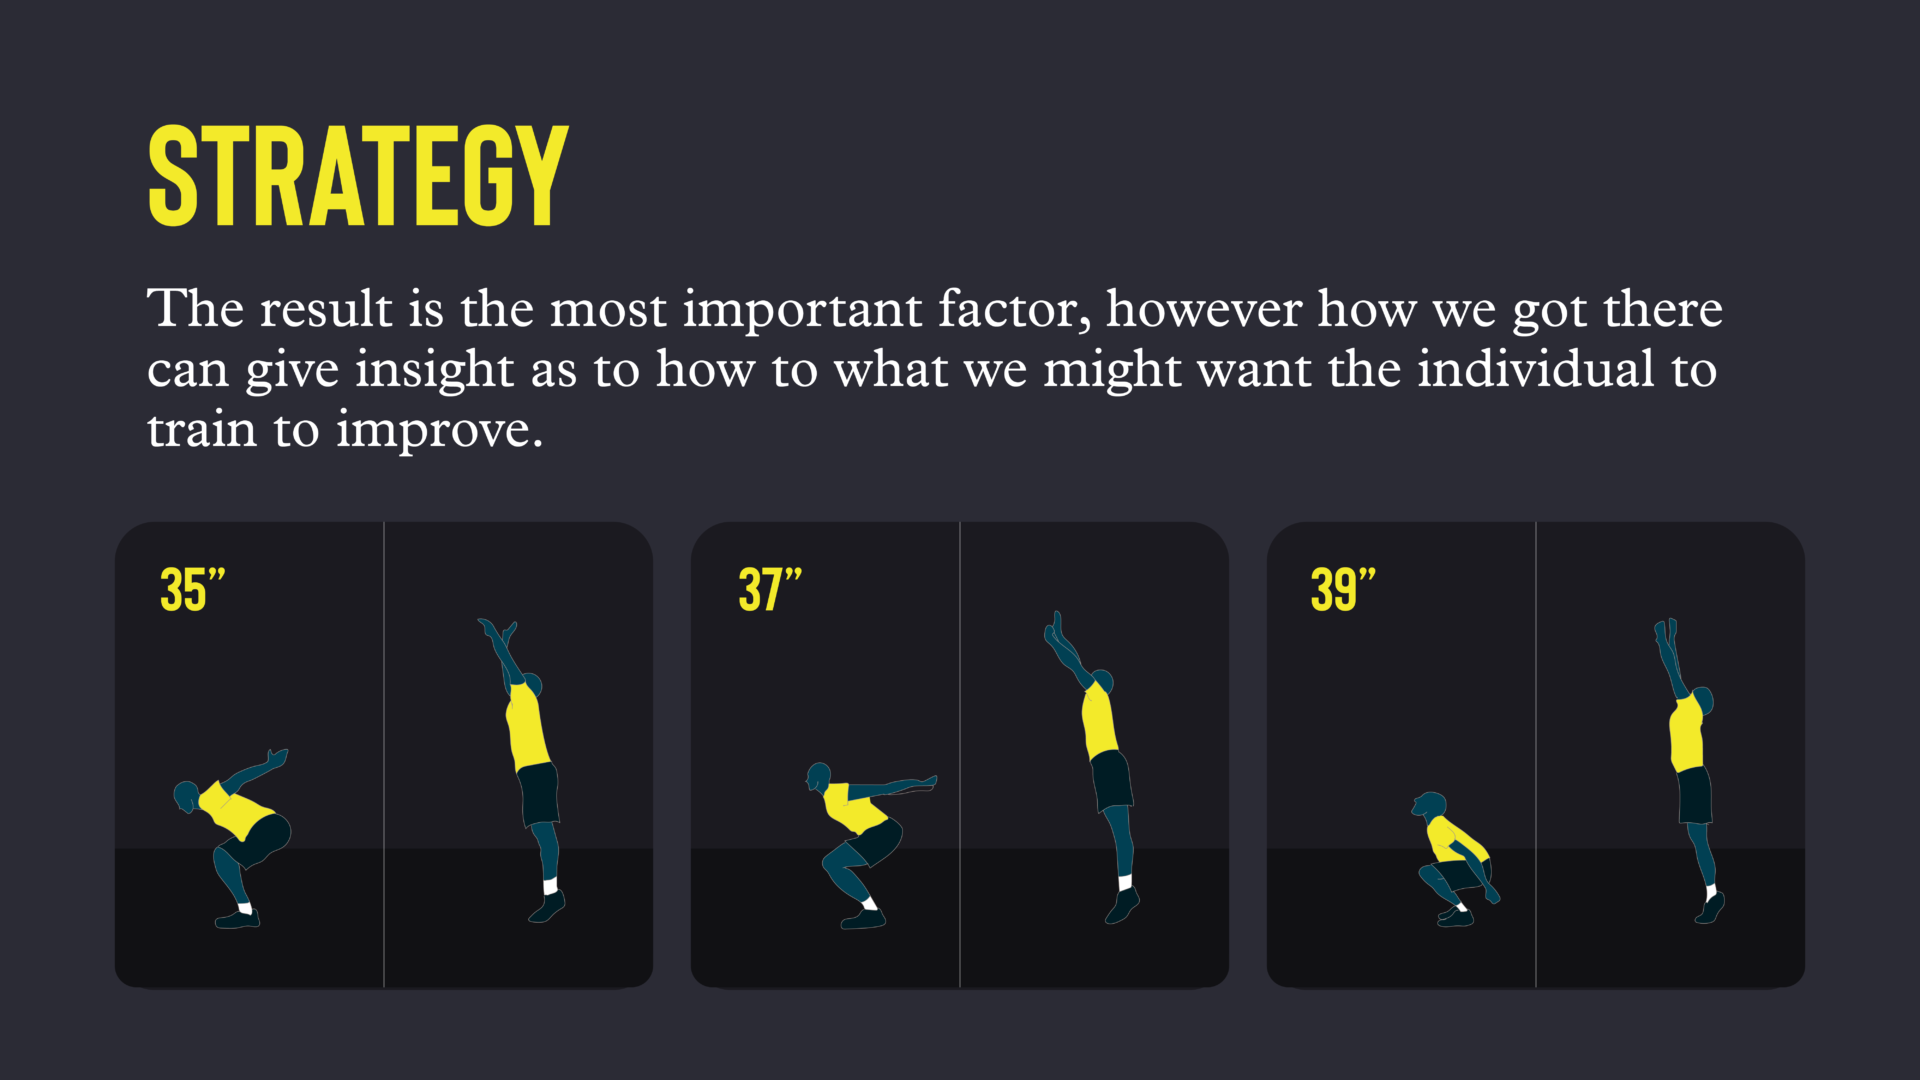
There’s no getting past Isaac Newton. The fundamental task in a CMJ is to produce the greatest amount of impulse: accelerating (producing force) as hard as possible, for as long as possible. Athletes can achieve this by producing greater peak forces, more quickly, and extending the time over which they produce high forces late in to the movement.
Tweet ThisThere’s no getting past Isaac Newton. The fundamental task in a CMJ is to produce the greatest amount of impulse: accelerating (producing force) as hard as possible, for as long as possible.
@TommyMunday1
More eccentric or more concentric training?
Assessing a paused squat jump against the CMJ can be a highly insightful test, allowing us to estimate how significantly an athlete uses the eccentric or loading phase of the CMJ.
Determine the eccentric utilisation ratio (EUR) by subtracting the paused squat jump from the CMJ, then divide by the CMJ.
For example:
48 cm CMJ – 44cm SJ = 4cm
4 cm / 48 cm = 8.3%
As general thresholds, if the EUR < 10%, the athlete has a relatively poor ability to use and load during the eccentric phase. EUR from 10-15% indicate a well-developed ability to use and load during the eccentric phase, but there are opportunities to improve the concentric phase. An EUR > 15% tells us to prioritise the athlete’s ability to generate high concentric forces rapidly.
Interestingly, the EUR is not associated with performance levels. But it may demonstrate whether an individual athlete is optimising their potential within the CMJ and its components, which contribute to performance.
Table 2 contains basic examples of modifying standard gym patterns to bias eccentric or concentric overload.
| Greater eccentric load (CMJ is < 10% greater than SJ) | Greater concentric load (CMJ is > 10% greater than SJ) | |
| Squat | Flywheel, box (touch and go) | Anderson, paused box, paused squat |
| Deadlift | RDL, slow eccentric trap bar | RDL from blocks or pins, trap bar |
| Single leg / lunge | Reverse lunge / SL RDL | Step up |
Tweet ThisAs general thresholds, if the EUR < 10%, the athlete has a relatively poor ability to use and load during the eccentric phase. EUR from 10-15% indicate a well-developed ability to use and load during the eccentric phase.
@TommyMunday1
Heavier (strength) or faster (ballistic) training?
Once we have identified the contraction type target, we next need to know whether an athlete needs ballistic or maximum strength work to develop their jump.
Adding load to the CMJ can be especially insightful. Some athletes’ jump height drops significantly with the addition of extra load, while others have more shallow, gradual drop-offs.
My preference for the loaded jump profile is using a trap bar, as it allows for the greatest amount of intent and output, while optimising safety during this movement.
Begin with a hands-on-hips CMJ, then load the trap bar in 10-30 kg increments. The athlete should perform 4-7 sets, cutting CMJ height by at least 50% over the course of the assessment. Then plot jump height vs. load and note the trendline.
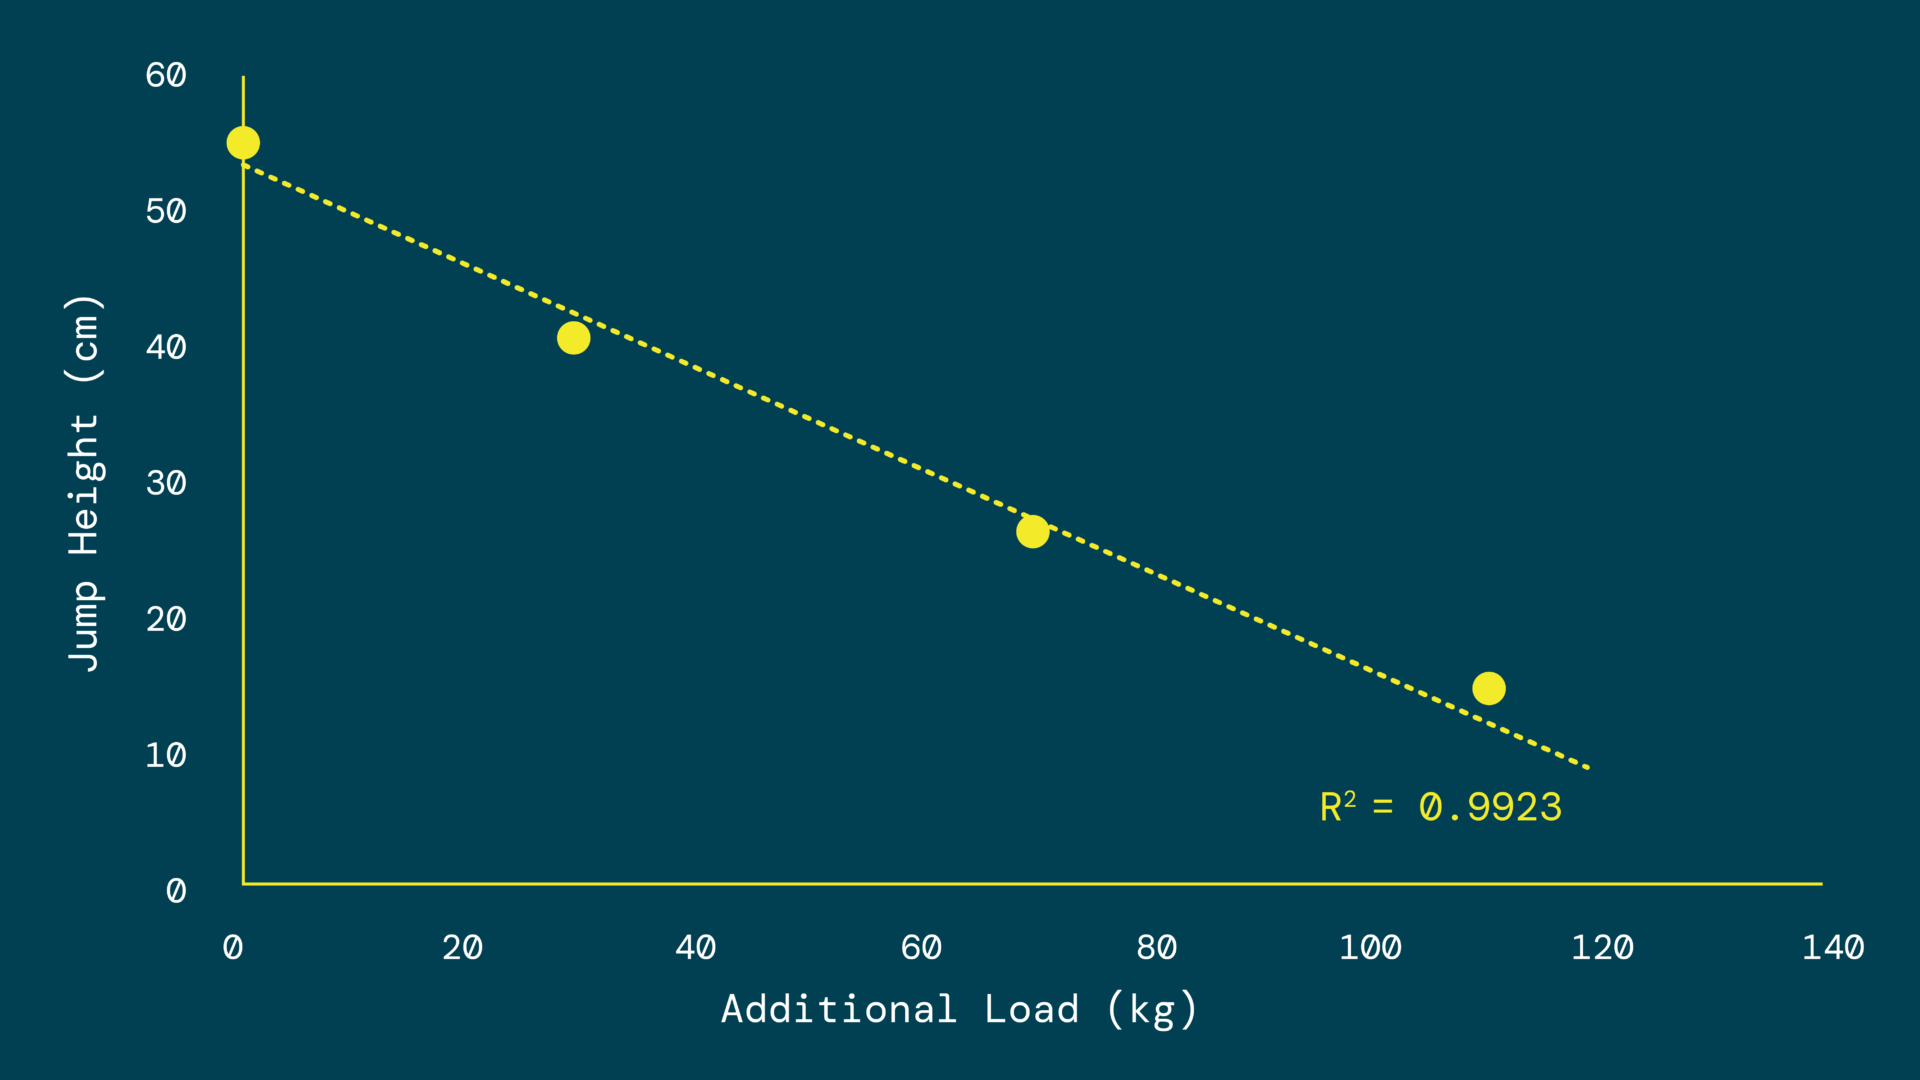
As load increases, an athlete is afforded more time to generate force, providing they have the capacity to do so. Therefore, the slope of the load vs. height gradient indicates how increased load affects an athlete’s ability to generate force.
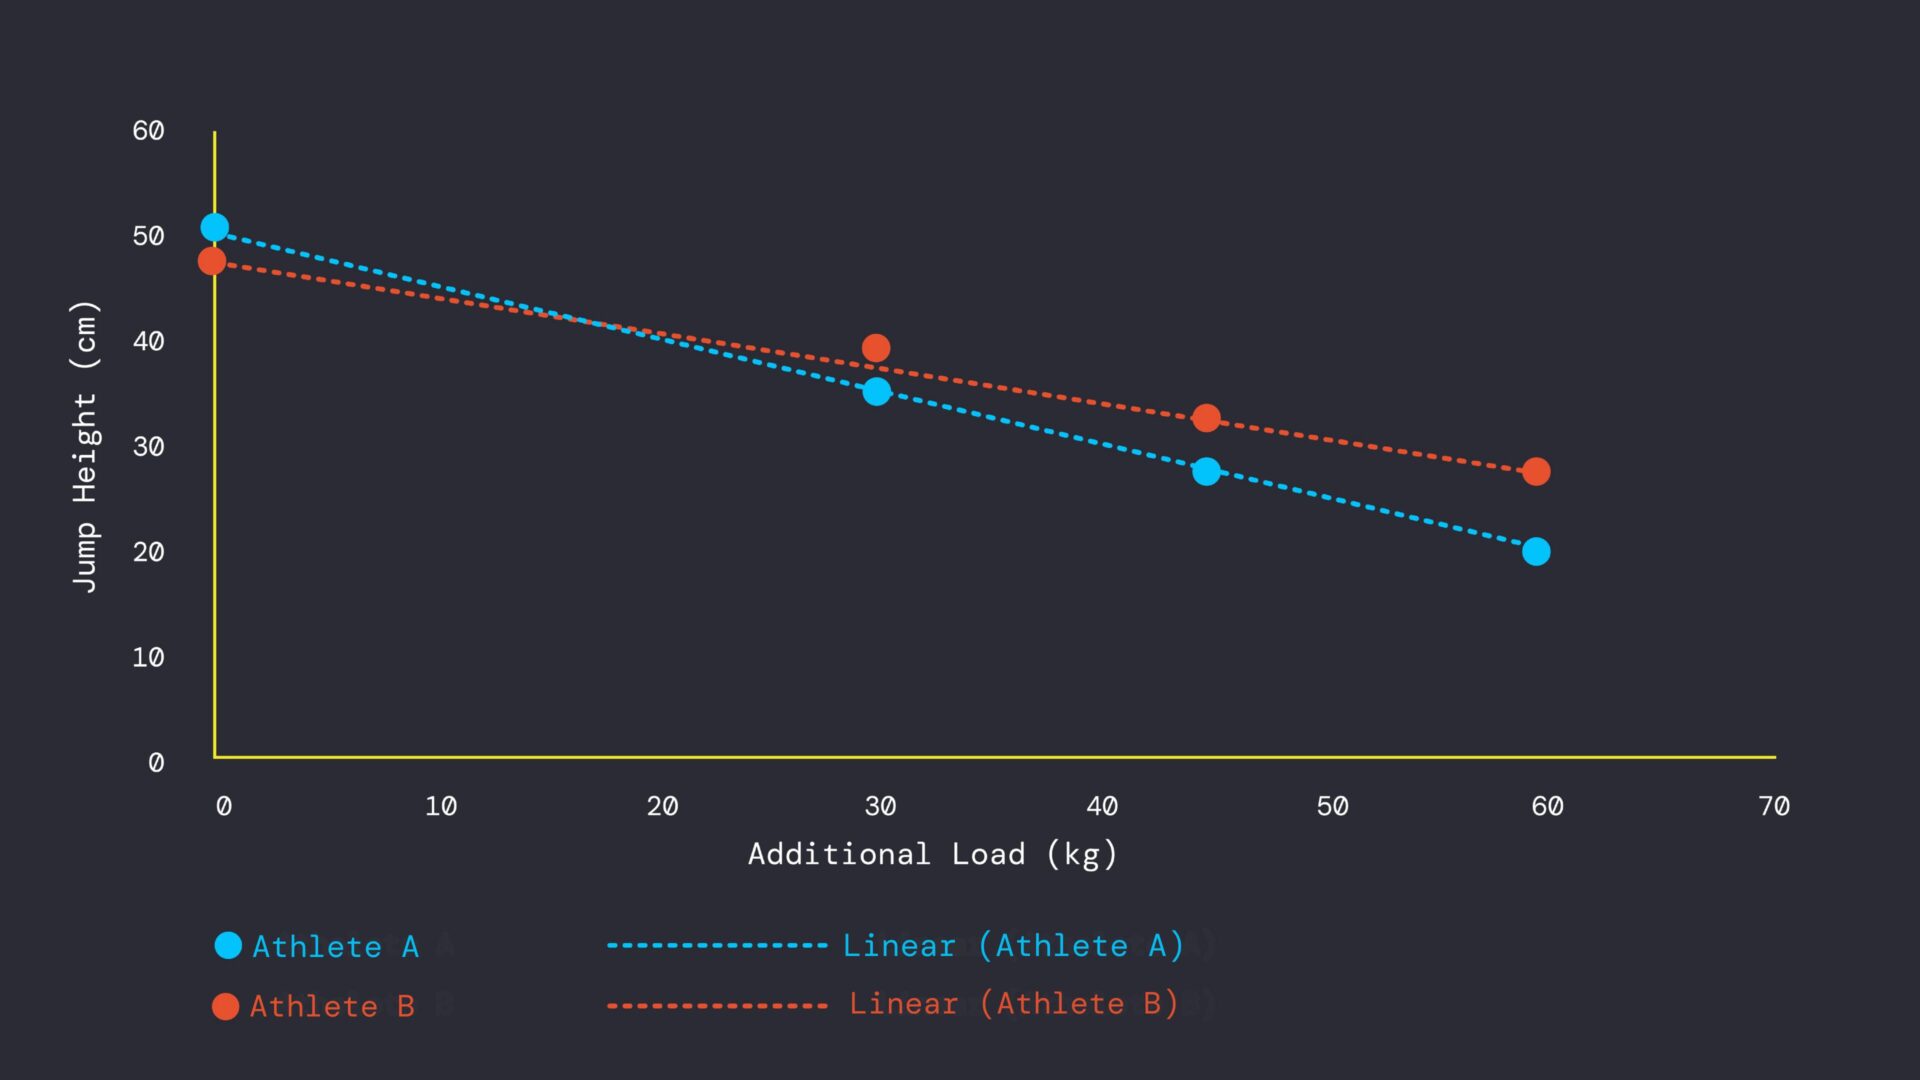
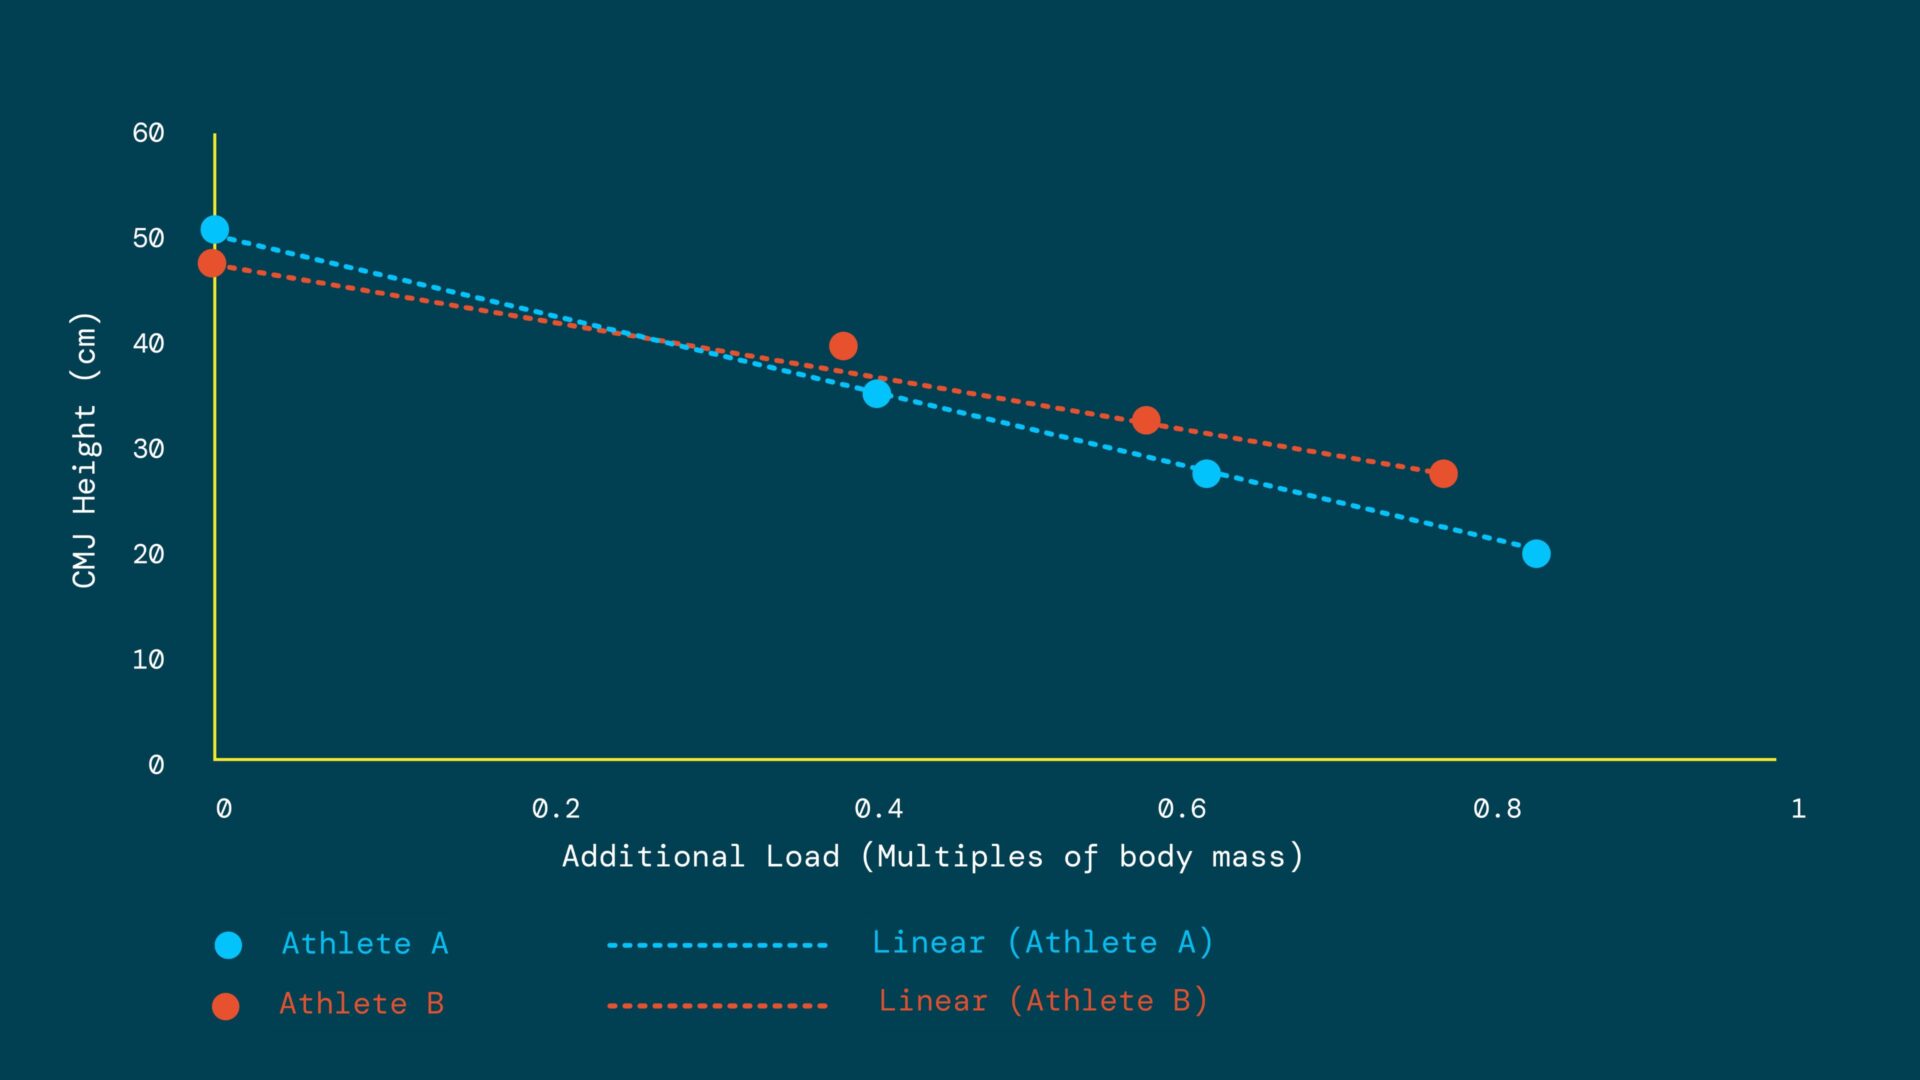
We carried out this assessment with two U18 sprinters with similar personal bests in the 100m (~11.5 s).
These athletes had similar unloaded CMJ heights (49 and 47 cm), but responded very differently to additional load.
Figures 5 and 6 show the load vs. jump height relationship for both athletes, first in absolute terms and then normalized to body mass. Although athlete A had a higher unloaded CMJ, he was increasingly outperformed by his teammate as the load went up.
Tweet ThisBegin with a hands-on-hips CMJ, then load the trap bar in 10-30 kg increments. The athlete should perform 4-7 sets, cutting CMJ height by at least 50% over the course of the assessment. Then plot jump height vs. load.
@TommyMunday1
More speed or more strength?
Athlete priorities and readiness for different training formats will shift over different stages of an athlete’s training. The constant for the S&C coach should be establishing when maximal strength is no longer the limiting factor to an athlete’s CMJ performance.
Carmelo Bosco wrote extensively about loaded jump profiling. He used jump height with 1x body mass additional load as an indicator of maximal strength. When compared against the unloaded CMJ, this gives a quick insight as to whether an athlete may be “strength dominant” or “strength deficient.”
Bosco determined and recommended an index of 0.33 for this measure. [4] For example, an athlete weighing 80 kg with a jump height of 45 cm should be able to jump 15 cm with an additional bodyweight of load.
If the athlete is below this level, they will most likely benefit from max strength training. If they achieve over this index, they are likely to be “strong enough” to jump higher, and may need more ballistic training targeting improvements of rate of force development.
With the last 50 athletes who have performed this assessment in my gym, the mean, median, and mode Bosco index for the collective data set are .33. Nearly 40 years on, Bosco is still valid.
With most athletes, my preference is to use the trendline to predict the 1 x BW jump rather than ask them to jump with this extra load, particularly if they are new to the programme. A moderately trained athlete can safely develop their profile with max effort straight away, with a relatively low technical barrier to entry. Most athletes can safely “really give it some” on their first session, so we can collect a valid and reliable profile for future decisions.
Table 3 summarizes the predicted data from the two sprinters, and what this suggests about the most useful training adaptations.
| Athlete A | Athlete B | |
| CMJ height (cm) | 49 | 47 |
| Loaded jump height (cm) | 13 | 20 |
| Bosco index | 0.26 | 0.43 |
| Intervention | Max strength | Ballistic / RFD |
Tweet ThisIf the athlete is below the 0.33 Bosco index, they will most likely benefit from max strength training. If they achieve over this index, they are likely to be “strong enough” to jump higher, and may need more ballistic training.
@TommyMunday1
Estimating performance without profiling
Most of my practice is with athletes in a 1-on-1 or small group setting, so I have time to take athletes through a profiling session like this. However, in a team or busier gym setting, the 10-20 minutes for one athlete is less practical.
There is a very strong association between maximum strength and loaded jump height. An athlete who can’t lift well with more than 2x bodyweight on a trap bar deadlift has a low chance of jumping high with 1x bodyweight on the bar.
To move 1x bodyweight with sufficient speed, the athlete needs a high reserve of maximal strength and force production. Trap bar deadlift 1RM performance appears to have a strong relationship with loaded jump performance, explaining roughly 60% variance.
This allowed us to put together some rough ranges to target within key compound movements in the gym. This may serve as a more practical alternative to a full profile, where we can track progress during training without the need for a full profiling session.
| Bodyweight CMJ target (cm) | Loaded jump target (33%; cm) | 1 x BW as a % of trap bar deadlift 1RM | Trap bar deadlift 1RM (x BW) | Romanian deadlift / back squat 1RM (x BW) | Box squat 1RM (x BW) |
| 55 | 18.0 | 37 – 44% | 2.3 – 2.7 | 1.7 – 2.0 | 2.0 – 2.3 |
| 45 | 15.0 | 45 – 51% | 1.9 – 2.2 | 1.4 – 1.7 | 1.6 – 2.0 |
| 35 | 11.5 | 55 – 61% | 1.7 – 1.8 | 1.3 – 1.4 | 1.5 – 1.6 |
For example, an athlete with a trap bar deadlift 1RM of 2.5x BW who cannot jump over 45 cm may benefit more from ballistic strength development, to encourage their body to generate force more quickly.
From metrics to programme design
The EUR and Bosco index allow us to pinpoint whether to pursue an eccentric or concentric intervention, and whether this should focus on maximal or ballistic strength. This reduces programme bias to a 2 x 2 matrix of eccentric or concentric, against ballistic or maximum strength.
Depending on competitive schedules, aim to test an athlete every 4-8 weeks to check the effectiveness of an intervention.

Table 5 shows one way to modify typical exercise categories to target these qualities.
| Developmental parameters | Bodyweight jump | Bilateral compound lift | Olympic lift | Single leg |
| Concentric x max strength | Trap bar deadlift | Clean pull from blocks | Step up / paused skater squat | |
| Eccentric x max strength | Trap bar deadlift (touch and go) or box squat | Hang clean pull | Split squat / lunge / skater squat (touch and go) | |
| Concentric x ballistic | Paused box jump: straight leg landing to 10% higher than best CMJ | Trap bar Jump from blocks | Hang power clean from blocks (knee / hip) | Single leg box jump to 50% of best CMJ with straight leg landing |
| Eccentric x ballistic | Depth jump from box 10% higher than best CMJ [5] | Trap bar CMJ or repeated trap bar CMJ | Hang power clean (fast eccentric) | Single leg CMJ / skater squat jump to stick landing |
Over the course of seven months, this athlete with a low training age achieved a 24% increase in CMJ height, using mostly maximum strength training interventions. Only in month 6 were they ready for more ballistic training formats.
The athlete’s progression appeared to stagnate from March to April, with the athlete showing a Bosco index just on the cusp of being ready for more ballistic training. When we introduced trap bar jumps in May, he achieved a significant increase.
| October | November | March | April | May | |
| CMJ | 37.1 | 40.2 (+8%) | 42.0 (+4%) | 43.4 (+3%) | 46.1 (+6%) |
| SJ | 33.9 | 33.6 | 40.4 (+20%) | 40.3 | N/A |
| EUR | 9% | 16% | 4% | 7% | |
| Loaded jump | 5.5 | 9.6 (+75%)* | 14.0 (+46%)* | 14.2 (+1%) | |
| Bosco index | 15% | 24% | 33% | 33% | |
| Intervention | Eccentric x max strength | Concentric x max strength | Eccentric x max strength | Eccentric x ballistic | |
| Key exercises | Progressed to touch and go box squat | Trap bar deadlift | Touch and go box squat | Trap bar CMJ at optimal impulse load | |
| Depth jumps from 50 cm |
The second athlete had a much higher training age. Coming towards the back end of their competitive season, they were proactive and wanted to put themselves in a great position for the following season.
This athlete had a “strength dominant” profile with a relatively low EUR. During their CMJ, you could see a relatively slow eccentric phase, which was more pronounced at the lighter loads.
Despite not lifting a weight over 60 kg, the athlete maintained—with a slight increase— their loaded jump performance and max strength, with an overall increase of 11% in their CMJ height in eight weeks.
| March | April | May | |
| CMJ | 49.2 | 52.8 (+7%) | 54.8 (+4%) |
| SJ | 45 | 46.9 (+4%) | 48.8 (+4%) |
| EUR (%) | 9% | 13% | 12% |
| 17.7 | 17.9 (+1%) | 19.1 (+7%) | |
| Bosco index | 36% | 34% | 35% |
| Intervention | Eccentric x ballistic | Concentric x ballistic | N/A |
| Key exercise(s) | Depth jump from 50-60 cm | Paused box jump | |
| Trap bar CMJ at optimal load | Trap bar jump from the floor at optimal load |
For ballistic and RFD work we’ll often jump with additional loads that optimise impulse to allow for high amounts of stimulus and demand generation of high forces quickly. [6]
We’ll typically have the athlete jump to and from boxes 0-10% higher than their best CMJ to drive intent. Straight leg landings encourage full hip extension and drive intent. If an athlete can land on the box with straight legs, cueing this presents a good challenge and consistent feedback.
Tweet ThisFor ballistic and RFD work we’ll often jump with additional loads that optimise impulse to allow for high amounts of stimulus and demand generation of high forces quickly.
@TommyMunday1