Training initial acceleration (0–10m) with the same approach across every position group in American football is likely a mistake. Uniformity in training overlooks a straightforward biomechanical reality: the magnitude of a player’s body mass influences which physical qualities separate fast players from slow ones.
A recent kinetic and kinematic analysis of 123 NCAA Division I American football players provides evidence.[1] Two findings define the practical implications.
First, maximal relative mechanical power (Pmax, W/kg) is the universal key performance indicator for initial acceleration. Its relationship with 0–10m time was large, nearly perfect, in fact, in every position group tested, with no other single variable approaching that consistency.
Second, the influence of mass-specific maximal propulsive force (F0, N/kg) scales with body mass. F0 explained meaningful variance in 0–10m performance among the heaviest players, and had almost no explanatory value among the lightest.
Power is a product of force and velocity. These findings, then, argue that a player’s body mass will determine the weighted relevance of either force (F0) or velocity to the expression of mechanical power during linear sprinting. A single acceleration training template applied uniformly across a roster is likely ineffective for improving initial acceleration performance.
This article will outline the mechanics behind that argument, and provide some implications for resisted sprint training based on the rate limiters of each position group.
Tweet ThisUniformity in training overlooks a straightforward biomechanical reality: the magnitude of a player’s body mass influences which physical qualities separate fast players from slow ones.
@CoachJosse
Direct measurement fills a methodological gap
Force-velocity profiling in American football has historically relied on scraping combine split times, without access to raw velocity-time data. The aforementioned study addressed that gap directly.
The players sprinted from a three-point stance, mirroring the NFL combine 40-yard dash. A 1080 Sprint captured velocity, while slow motion 2D video captured sagittal plane kinematics. Velocity data generated individual sprint force-velocity profiles. The digitized video captured push-off and the first three steps at toe-off and touchdown.
Players were grouped into three broad position categories: skill, big skill, and lineman. This segmenting helped determine whether the mechanical and technical variables associated with faster 0–10m times differed by body type.

The sprint force-velocity profile reduces a sprint to three broad interrelated metrics. F0 is an athlete’s theoretical maximal propulsive force, expressed at near-zero velocity (i.e., as in the initial drive out of a stance). V0 is the athlete’s theoretical maximal velocity, which they reach when propulsive force approaches zero. And Pmax is the apex of the power curve, representing the combination of the athlete’s theoretical force and velocity.
Two athletes can register an identical Pmax while executing different mechanical strategies: one force-dominant, one velocity-dominant.

Across the sample, Skill players were the most velocity-oriented, with big skill players close behind them. Linemen exhibited a distinct force-dominant profile.
Profile orientation alone, however, does not indicate how a player produces speed. This is why the analysis focused on the two variables most closely tied to initial acceleration: F0 and Pmax. V0 and top speed mechanics will be addressed in a separate, forthcoming analysis.
Tweet ThisF0 is an athlete’s theoretical maximal propulsive force. V0 is the athlete’s theoretical maximal velocity, which they reach when propulsive force approaches zero. And Pmax is the apex of the power curve.
@CoachJosse
Power output predicts acceleration regardless of position
Pmax demonstrated a large-to-nearly-perfect relationship with 0–10m time across every position group (r = -0.60 to -0.90; p < 0.001), making it the most consistent single predictor in the study.
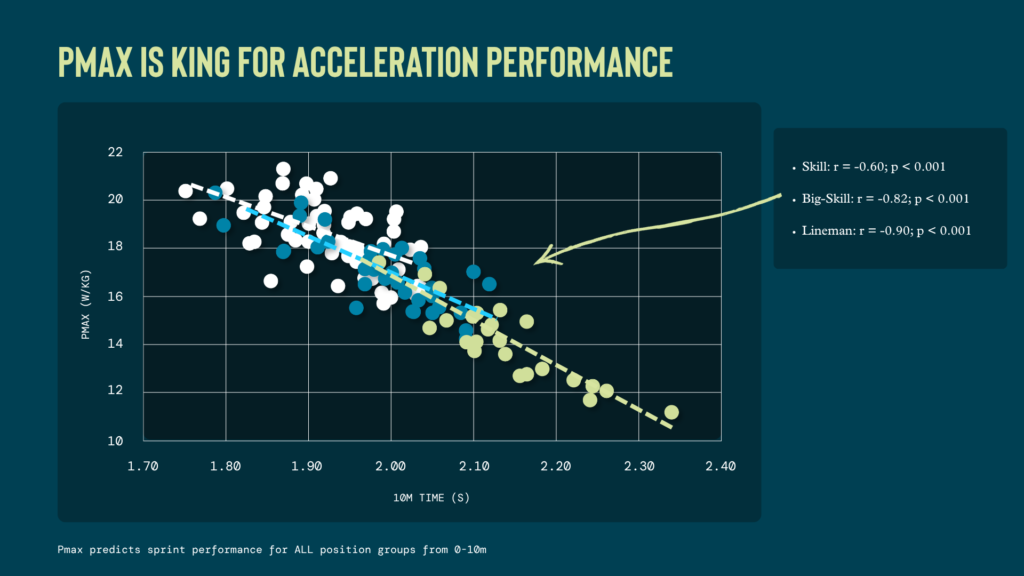
For practitioners monitoring acceleration development across a training block, Pmax is the primary key performance indicator, irrespective of playing position.
The data diverge by position when it comes to the role of F0. Among the lightest players, F0 showed a small relationship with acceleration performance. Among the heaviest, it approached the predictive strength of Pmax. That is, higher relative force output distinguished faster linemen from slower ones, with a smaller but present effect in the big skill group. For skill players, F0 did not meaningfully differentiate performance.
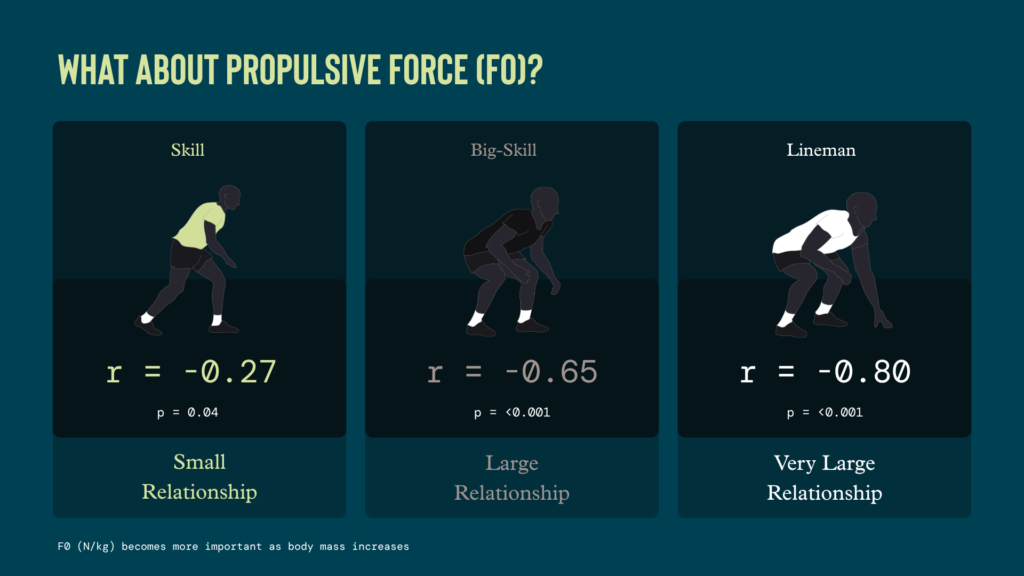
The mechanism becomes clearer when isolating a single comparison. F0 differed by approximately 4% between the big skill and skill groups, while body mass differed by approximately 21%. The big skill athletes were not producing substantially different relative force. They were applying comparable force against a considerably larger body mass.
As athletes’ body mass increases, generating sufficient relative propulsive force to overcome body mass, inertia, and gravity becomes a genuine rate limiter during the first steps of a sprint.
Athletes with lower body masses achieve this task more easily, making relative propulsive force less indicative of initial acceleration performance.
Measures of mechanical effectiveness reinforced this pattern. The maximal ratio of force (RFmax), the proportion of total ground reaction force directed horizontally during early acceleration, related significantly to 0–10m time only in the lineman group (r = -0.72).[2] For heavier players contending with their own mass, orienting force more horizontally distinguished performance. For skill and big skill players, force magnitude mattered more than force orientation.
Tweet ThisAs athletes’ body mass increases, generating sufficient relative propulsive force to overcome body mass, inertia, and gravity becomes a genuine rate limiter during the first steps of a sprint.
@CoachJosse
Technical signatures of higher-power acceleration
Several kinematic variables tracked with higher Pmax across all groups, giving practitioners external markers of well-directed acceleration. Spatiotemporally, higher-power acceleration was associated with shorter ground contact times, greater takeoff and step velocities, and longer flight lengths, less time on the ground and greater projection of the centre of mass (CM) between steps.
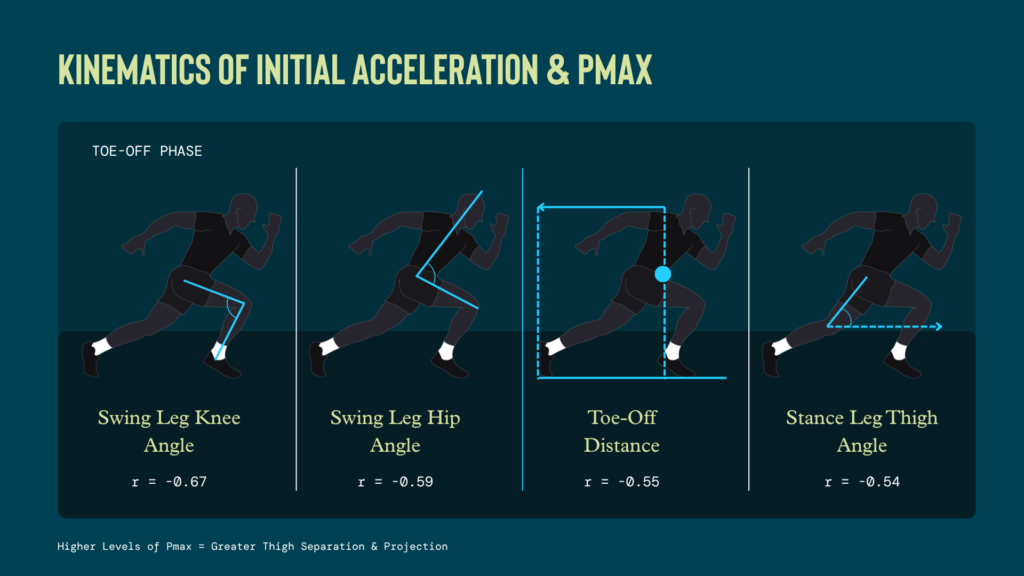
At toe-off, the strongest associations were a more flexed swing leg knee and hip, a greater toe-off distance (the toe trailing well behind the CM), and a more extended stance leg thigh. Collectively, these describe an athlete generating substantial thigh separation and projecting the CM forward as the stance leg completes extension, rather than remaining upright and over-striding.
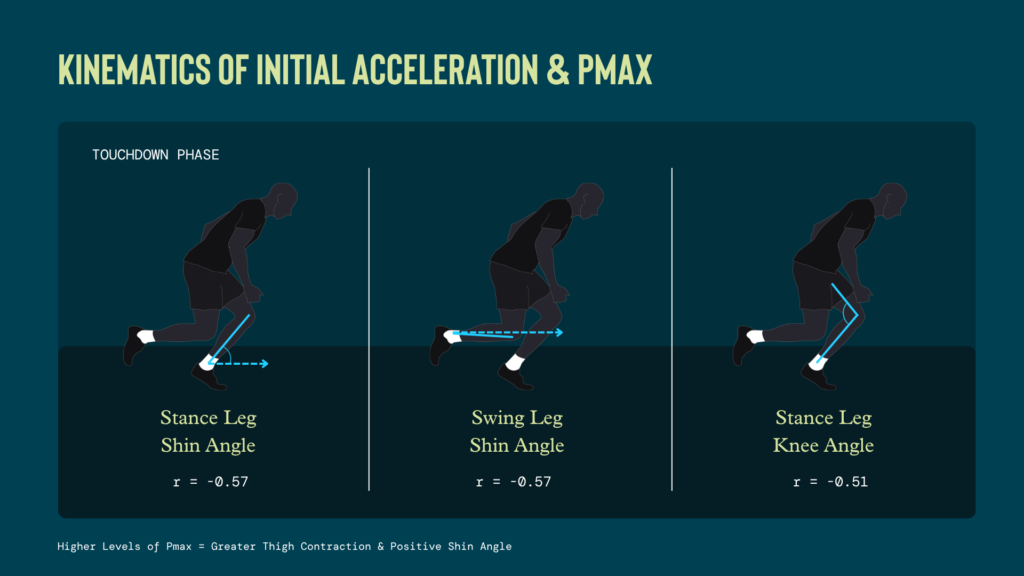
At touchdown, higher-power athletes exhibited reduced stance leg shank and knee angles, and their swing leg shank rotated toward horizontal. The foot contacted the ground more beneath the hip with a positive shin angle, and the swing leg actively recovered to initiate the subsequent drive.
These positions translate into cueing targets. At toe-off, cues emphasizing knee drive and aggressive ground displacement (“punch the knee,” “push the ground away”) reinforce thigh separation and forward projection. At touchdown, cues directing the foot beneath the hip with active swing leg recovery (“foot under hip,” “rip the knee through”) support the desired contact mechanics.
Importantly, these kinematic relationships were present across the full sample rather than within position groups. They represent population-level tendencies rather than position-specific prescriptions. Whether they differ by body type warrants further investigation. Moreover, the pursuit of a single “optimal” technique is likely unproductive. Athletes reach comparable outputs through demonstrably different coordination strategies.
Practitioners should approach the signatures above as tendencies to bias toward, not templates to impose.
Tweet ThisSpatiotemporally, higher-power acceleration was associated with shorter ground contact times, greater takeoff and step velocities, and longer flight lengths, less time on the ground and greater projection of the centre of mass.
@CoachJosse
Programming resisted sprints by position group
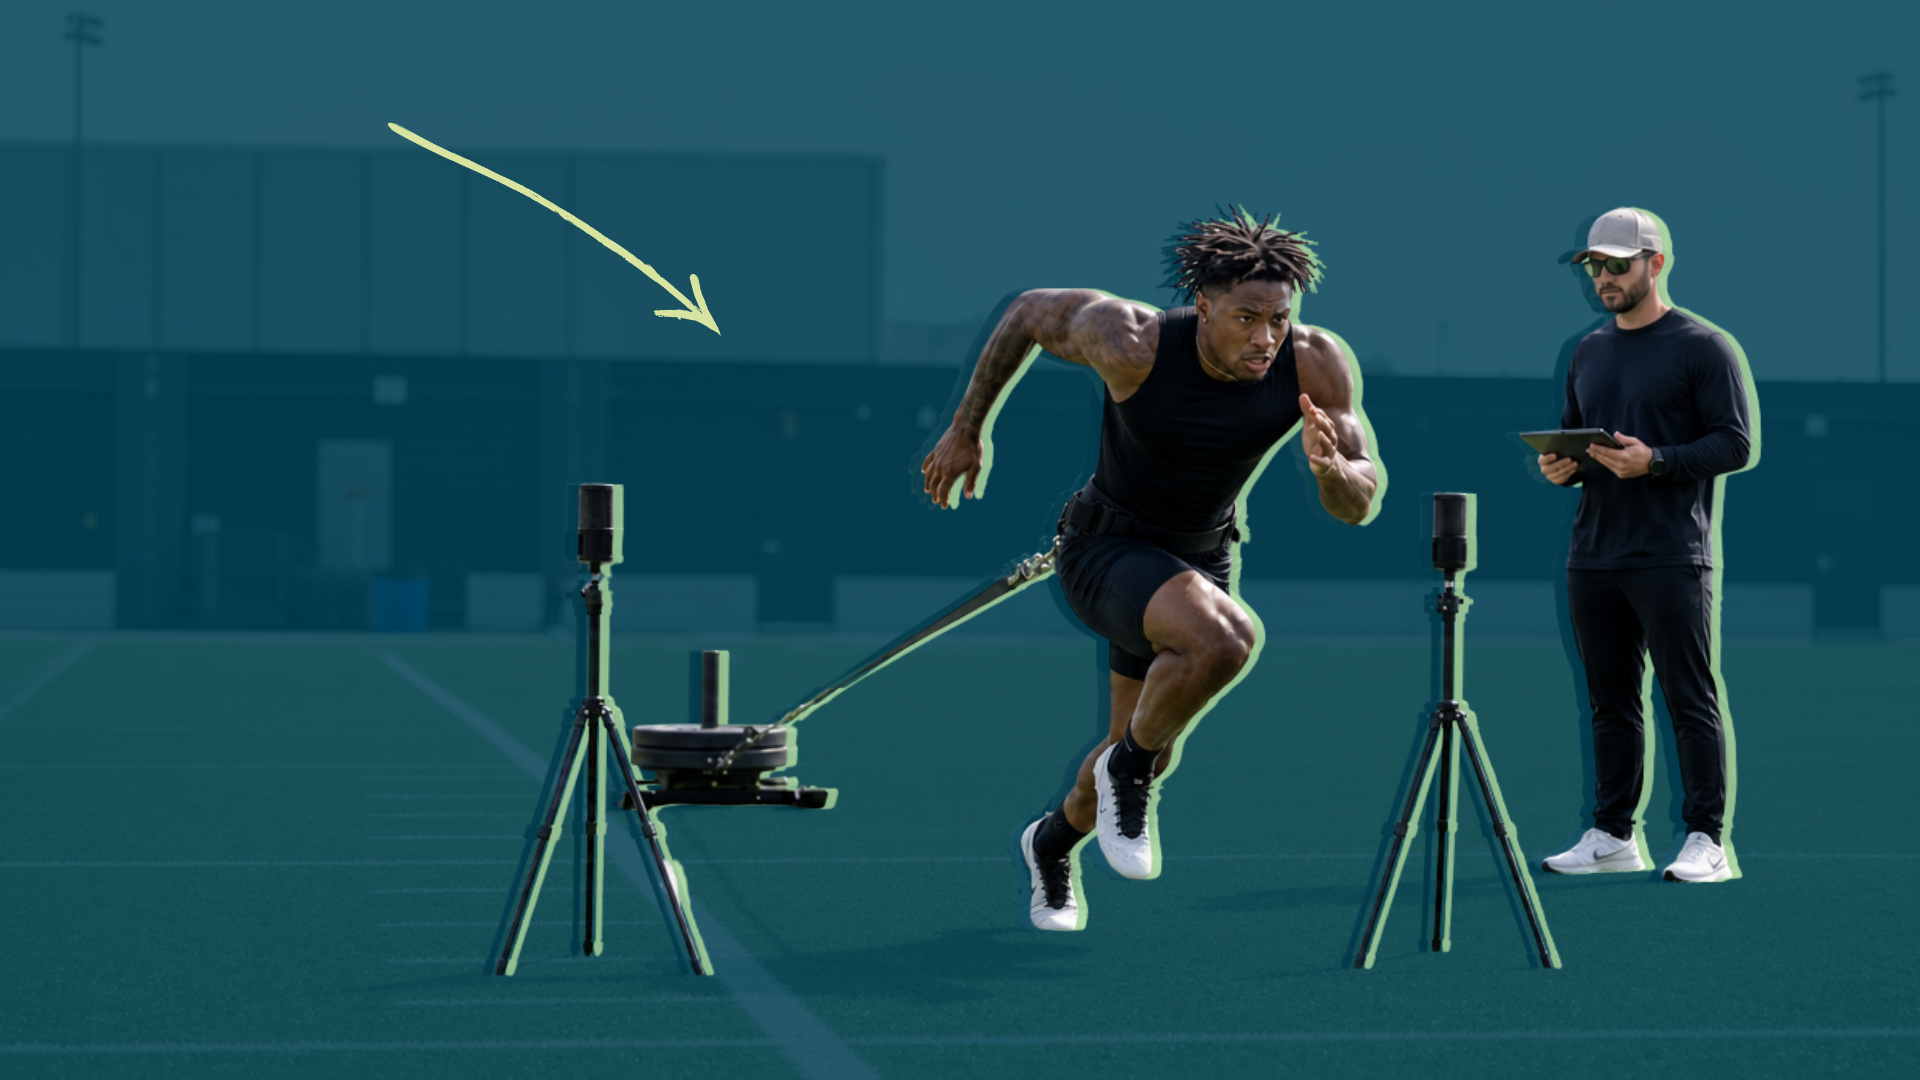
The practical value of this framework lies in how it informs training, specifically, resisted sprinting, a near-ubiquitous method in American football speed development. The recurring question is not whether to use resisted sprinting, but how much load to impose.
Historically, resisted sprint load has been prescribed as a percentage of body mass (%BM). This is an imprecise standard. An identical %BM imposes markedly different demands across athletes of differing capability, and effective resistance varies further with turf and sled friction.
Prescribing by velocity decrement (Vdec), the reduction in sprint velocity relative to an athlete’s unresisted maximum, standardizes the stimulus to the individual.[3]
A 30% Vdec, for instance, corresponds to loading until the athlete reaches 70% of free-sprinting velocity.
There is a useful reference point for athletes whose primary objective is Pmax development. The load that maximizes power output during resisted sprinting occurs at approximately 50% velocity decrement.[4]
Practitioners can use resisted sprinting not only to expose athletes to an environment of peak power output, but also to develop its underlying components. For example, heavier loads bias adaptation toward propulsive force and mechanical effectiveness.[5] Lighter loads preserve higher velocities and bias the velocity end of the profile.
The programming logic follows directly: anchor resisted sprint training near the power-optimal load (50% Vdec), then shift the emphasis toward the quality that most limits each position group.

Because F0 co-limits acceleration in heavier athletes, linemen are positioned at or above the optimal power load (approximately 50–70% Vdec) to develop the force capacity they most require. Skill players, for whom force is not a differentiator, are positioned below it (approximately 10–30% Vdec) to bias more velocity. Big skill players occupy the intermediate range (approximately 30–50% Vdec).
These loading recommendations derive from two sources: the broader force-velocity and resisted sprint literature, and the correlations that surfaced in this population. They do not constitute a validated training intervention. No published work has validated this approach of differentiating resisted sprint prescription by body mass, nor using the rate-limiting parameter as the basis for prescription.
The bands presented above are a reasoned starting point, and the framework is experimental. This is not a proven protocol.
Practitioners who wish to “stress test” this approach can profile their athletes, prescribe toward each athlete’s limiting quality (force for heavier players, velocity for lighter ones) hold the remainder of the program reasonably constant, and monitor the response in Pmax and sprint performance. If the predicted levers fail to shift performance, that outcome is itself informative. The objective is to build training around these rate limiters and establish whether the observed relationships hold when directly manipulated.
Tweet ThisThe programming logic follows directly: anchor resisted sprint training near the power-optimal load (50% Vdec), then shift the emphasis toward the quality that most limits each position group.
@CoachJosse
Representative profiles: Same task, different templates
The clearest divergence between groups is between the lineman and skill players.
A lineman produces relative force modestly below that of a skill player, yet applies it against nearly 50kg (110 lbs) more body mass. Force is the operative rate limiter. The corresponding emphasis is heavier resisted sprinting (~50–70% Vdec) over short distances (10–20 yards), supported by heavy sled marches, with both Pmax and F0 monitored over time.
The skill player expresses more force for his mass, but this offers diminishing returns. Velocity-derived power sets these players apart. Lighter resisted loads (~10–30% Vdec) are warranted, supported by high-velocity sprinting over longer distances (20–50 yards), and Pmax as the monitoring priority.
| Sprint-related Variables | A Representative Lineman | A Representative Skill Player |
| Body Mass | 134kg (295lbs) | 86kg (190lbs) |
| 0-10m Time | 2.14s | 1.93s |
| Pmax | 14.3 W/kg | 18.6 W/kg |
| F0 | 7.1 N/kg | 7.8 N/kg |
The significance lies in what the stopwatch omits.
For example, the fastest linemen in the sample covered 0–10m in 1.98s, which was quicker than the slowest skill player at 2.04s. Judged on split time alone, those two athletes are interchangeable, and would plausibly receive the same program.
Their profiles say otherwise. One is limited by the force available to move his mass; the other has force to spare and is limited by how fast he can apply it. The same resisted load advances neither: it might be too light to develop what the lineman lacks and too heavy to expose the skill player to the velocities that differentiate him.
The clock identifies who is fast. The profile identifies why, and therefore better informs what to train.
Tweet ThisThe skill player expresses more force for his mass, but this offers diminishing returns. Velocity-derived power sets these players apart. Lighter resisted loads (~10–30% Vdec) are warranted, supported by high-velocity sprinting over longer distances.
@CoachJosse