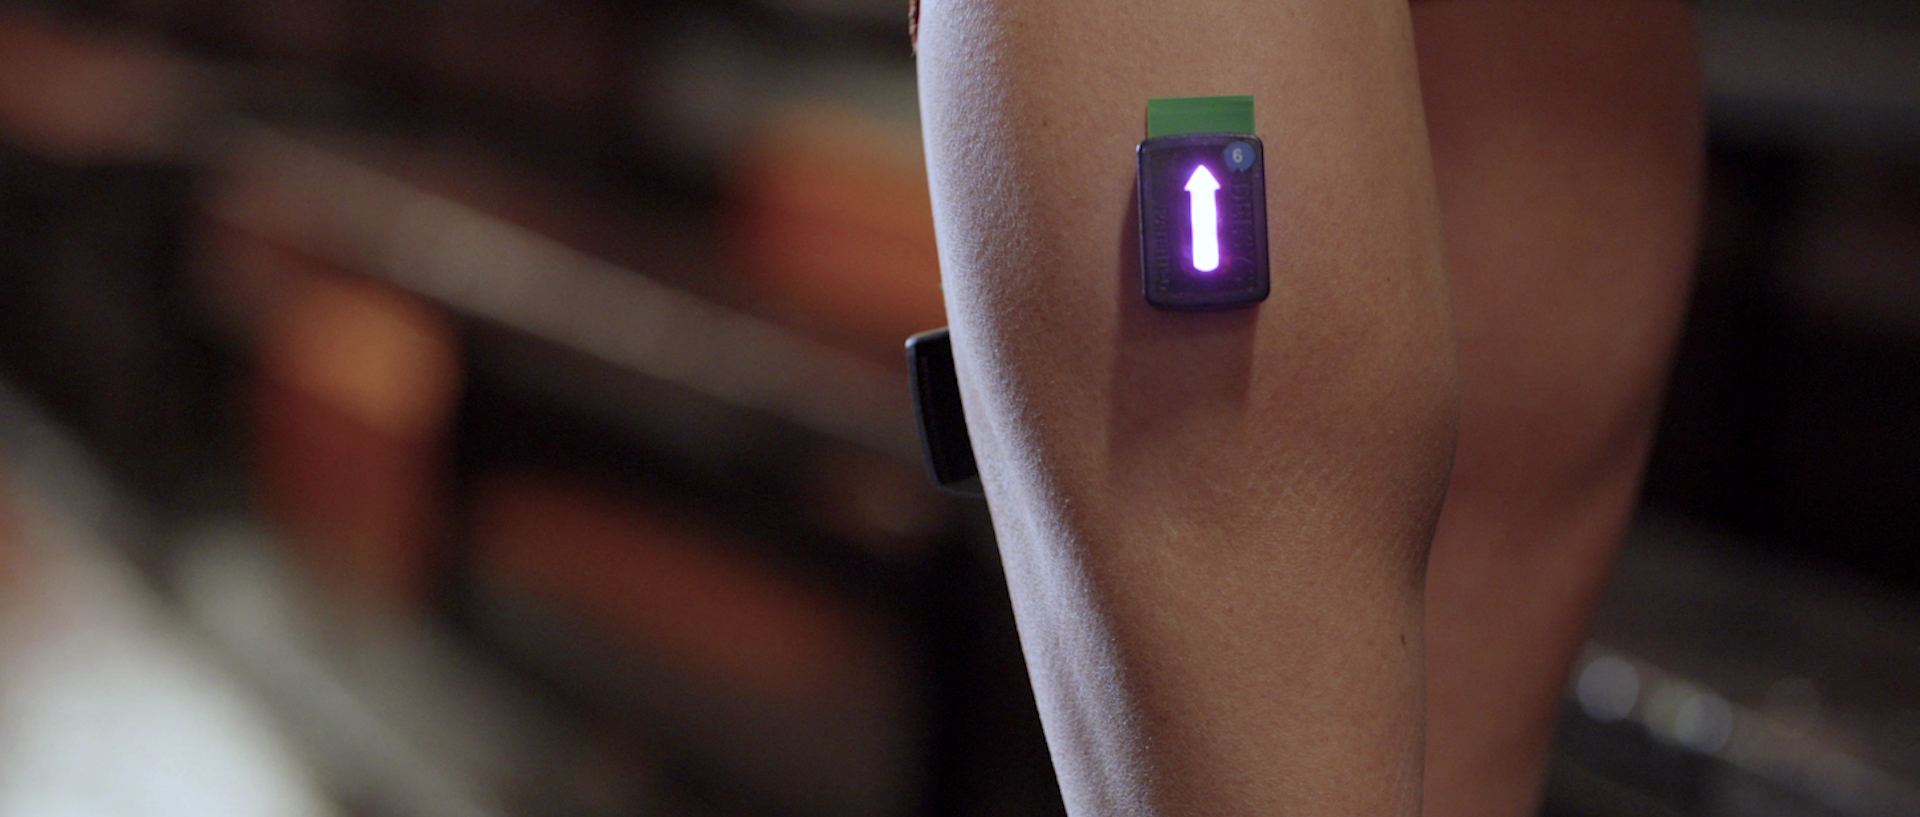
Surface electromyography (sEMG) is no longer confined to research laboratories. Wireless systems, such as Delsys, make sEMG feasible in clinical and performance settings, allowing practitioners to examine how the individual muscles of the triceps surae contribute to a task rather than treating the calf as a single unit.
sEMG is not a diagnostic tool and it does not measure force. It provides a window into an athlete’s motor recruitment strategy, provided the results are interpreted in context.
sEMG sits alongside isokinetic dynamometry, isometric force testing, jump assessments, and ultrasound to profile athletes, and during assessment and rehabilitation of lower-limb injuries. The output reveals that different calf and Achilles injuries leave distinct fingerprints in how the triceps surae is recruited afterwards. Medial gastrocnemius strain, soleus strain, Achilles rupture, and Achilles tendinopathy do not produce the same pattern; nor do they resolve on the same timeline either.
Tweet ThissEMG sits alongside isokinetic dynamometry, isometric force testing, jump assessments, and ultrasound to profile athletes, and during assessment and rehabilitation of lower-limb injuries.
@colingriffin
What sEMG signal actually represents
Motor unit recruitment and firing rate are the major inputs to surface EMG amplitude. Electrode position, muscle geometry, tissue composition, and skin contact also influence the output. Practitioners must consider these factors before drawing conclusions from the signal. Changes in any of them will change the signal, independent of what the muscle is actually producing mechanically.
The 2024 CEDE consensus on using EMG to estimate muscle force is clear on this point, and worth reading if you work with sEMG regularly.[1]
Particularly in sport and rehabilitation, amplitude differences between conditions or individuals are routinely over-interpreted. The meaning of any amplitude value depends heavily on what else is happening in the system.[2]
sEMG helps us understand relative contributions across the medial gastrocnemius (MG), lateral gastrocnemius (LG), and soleus (SOL) during isokinetic plantarflexion testing at 30°/s, seated isometric force testing, jump assessments, and rehabilitation exercises. It is also useful for biofeedback in rehab.
While more complex analyses like decomposition or spectral analysis are possible, they aren’t realistic for a routine clinical workflow.
Peak raw amplitude and maximum voluntary isometric contraction-normalised (MVIC) amplitude are the most important, relevant, and usable metrics. Peak amplitude, when normalised to a consistent MVIC reference collected in the same session with the same electrode placement, remains a defensible and useful comparator for within-session, within-subject analysis.
Tweet ThisMotor unit recruitment and firing rate are the major inputs to surface EMG amplitude. Electrode position, muscle geometry, tissue composition, and skin contact also influence the output.
@colingriffin
Electrode placement: Little margin for error
SENIAM guidelines are the standard starting point for electrode placement, skin preparation, and acquisition parameters.[3] Applying electrodes to the triceps surae, though, requires extra care.
The MG, LG, and SOL show considerable individual variation in geometry, motor point location, and the position of intramuscular aponeuroses. Placing an electrode over or too close to an aponeurosis will reduce the recorded amplitude, irrespective of the muscle’s activity.
The SOL is the most demanding in this respect. Its central tendon and both the medial and lateral intramuscular aponeuroses (IMAs) occupy meaningful proportions of the muscle’s cross-section. Moreover, there are considerable individual anatomical variations, and their positions are not predictable from surface landmarks alone. Fatty infiltration, often a legacy of major injury or disuse, further compromises the recording. Once again, the signal is lower, but the muscle is not necessarily less active. The electrode is simply a recording artefact that we need to account for during electrode placement and output analysis.
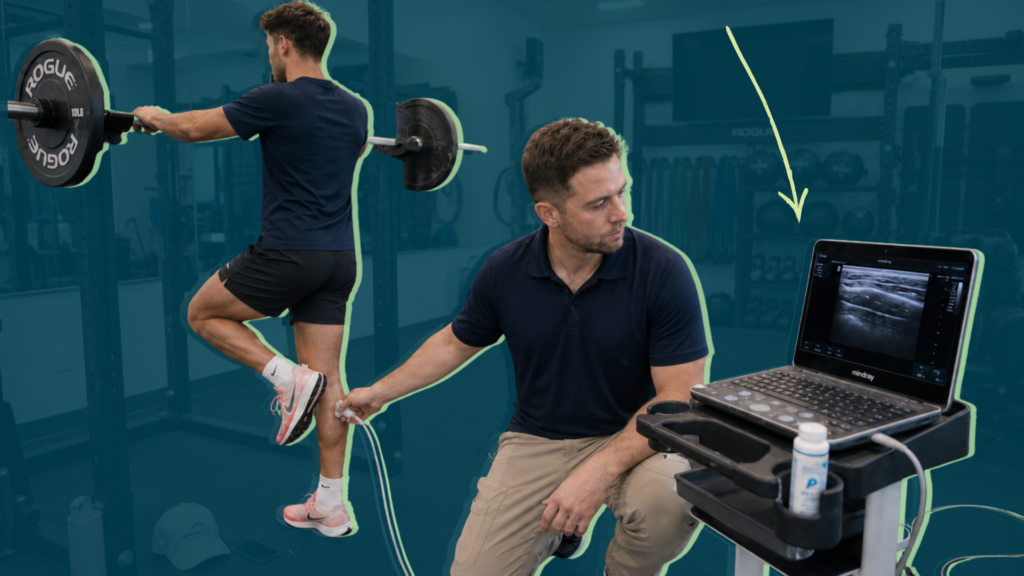
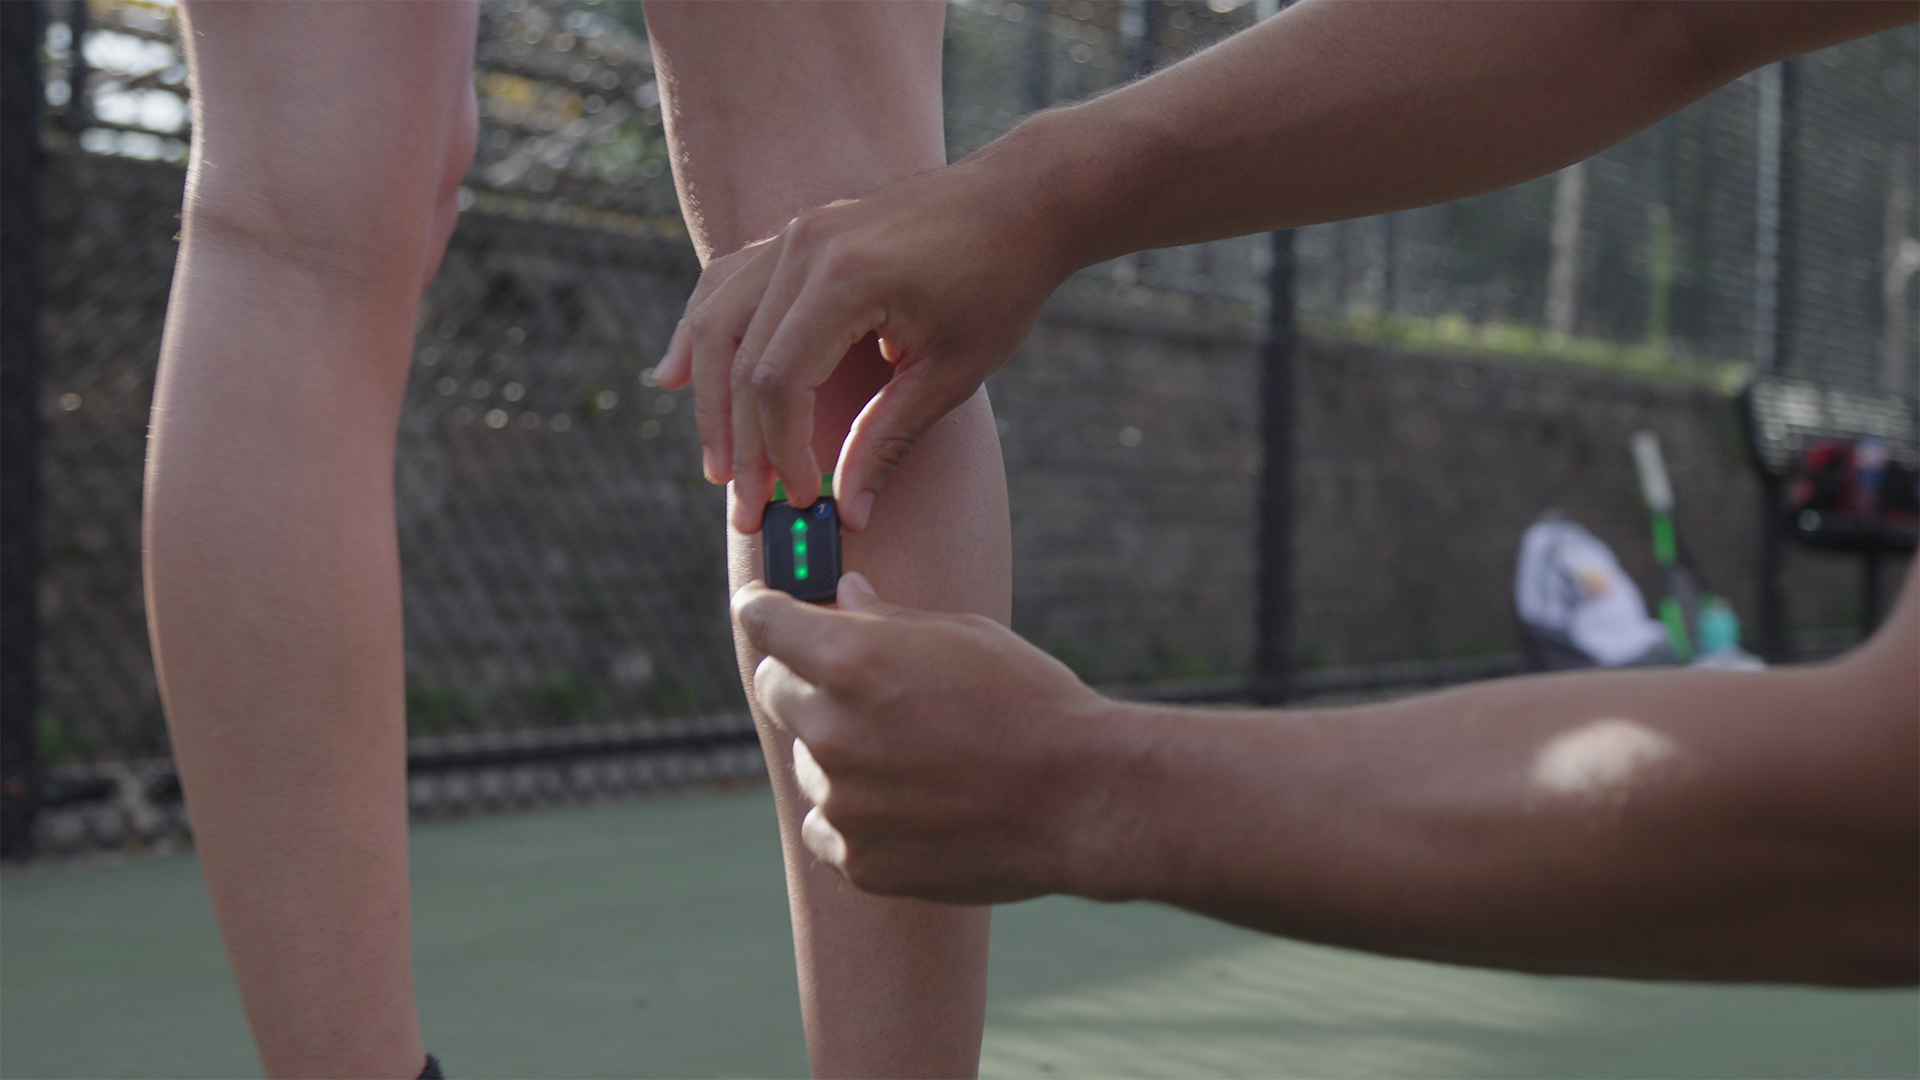
Ultrasound can help guide electrode placement.[4] It directly identifies the muscle belly, confirms the position of internal tendons or aponeuroses, and lets practitioners avoid regions of altered echogenicity due to denervation-induced fatty infiltration. It adds a few minutes to the assessment, and substantially increases confidence in the signal.
Ultrasound also integrates naturally with the morphological assessment. We’re already scanning the muscle to evaluate muscle architecture, thickness, and echogenicity, so guiding electrode placement in the same sitting is straightforward.
Cross-talk between MG and LG is another concern, given their proximity; as is contamination of the SOL signal from the overlying gastrocnemius.
Ultrasound helps to define muscle boundaries, but it does not eliminate the problem. Practitioners should be cautious about interpreting small amplitude differences between adjacent muscles in isolation, and treat the EMG data as one part of a broader picture rather than a standalone finding.
Tweet ThisUltrasound also integrates naturally with the morphological assessment. We’re already scanning the muscle to evaluate muscle architecture, thickness, and echogenicity, so guiding electrode placement in the same sitting is straightforward.
@colingriffin
Why individual muscle assessment matters in the calf
The triceps surae is three muscles, not one. MG, LG, and SOL differ in architecture, fibre-type distribution, moment arm geometry, and function. The MG and LG are biarticular, SOL is not.
Crucially, these muscles do not reliably share a common neural drive. Selective under-recruitment of one muscle is neurologically plausible, not theoretical.[5] They can be controlled independently. Following injury or pathology, they often are.
This matters mechanically because MG, LG, and SOL each contribute force through anatomically distinct regions of the Achilles tendon. Their respective subtendons have different mechanical properties and load exposure. Altered force-sharing between the three muscles changes the distribution of load across the tendon’s cross-section, which has implications for local strain and interfascicular shear. Individuals with Achilles tendinopathy show altered force-sharing, consistent with this mechanism.[6]
The clinical picture in Achilles tendinopathy is more specific than previously assumed. A recent review challenges the longstanding emphasis on the soleus as the primary problem in this population.[7]
The evidence points to a consistent pattern of selective LG involvement: reduced neural drive at lower contraction intensities, selective atrophy relative to the broader triceps surae, and a reduced LG contribution to plantarflexion force. Whether this drives the pathology or develops in response to it remains unclear. Regardless, a one-size-fits-all approach to the calf simply won’t address these individual deficits.
Following medial gastrocnemius strain, a different pattern can emerge.
The injured limb can have greater SOL EMG activity during a heel-rise task, with no significant difference in normalised MG activity. A higher SOL:MG ratio on the injured side results.[8] This pattern often shows up clinically, with reduced MG EMG activity during higher intensity plantarflexion tasks.
Total strength output can still look reasonable despite a meaningful shift in recruitment strategy.
In other cases, the EMG findings sit alongside strength and architectural deficits, giving a much clearer pattern.
Soleus activity also needs to be interpreted in relation to muscle operating length and fatigue. In healthy young adults, a more plantarflexed ankle position shortened soleus fascicles by 14%, required roughly twice the EMG amplitude to achieve the same task demand, and reduced time to task failure by 60%.[9] EMG median frequency also fell as fatigue developed at both ankle positions. This does not directly explain an injured athlete’s EMG profile, but it is a useful reminder that a lower or higher soleus signal is not simply a reflection of neural drive. Fascicle length, joint position and fatigue state all matter.
Anecdotally, SOL EMG activity declines following soleus strain and Achilles tendon rupture, both on return to training and in athletes with longstanding injury. In these cases, it often sits alongside strength and architectural deficits. This is why I assess the individual muscles rather than relying on aggregate plantarflexor force alone.
Integrating sEMG with force, jump and imaging data
EMG in isolation, a single amplitude value, tells us nothing useful. A pattern that repeats across tasks aligns with what ultrasound shows and is accompanied by a specific finding in the force or jump data.
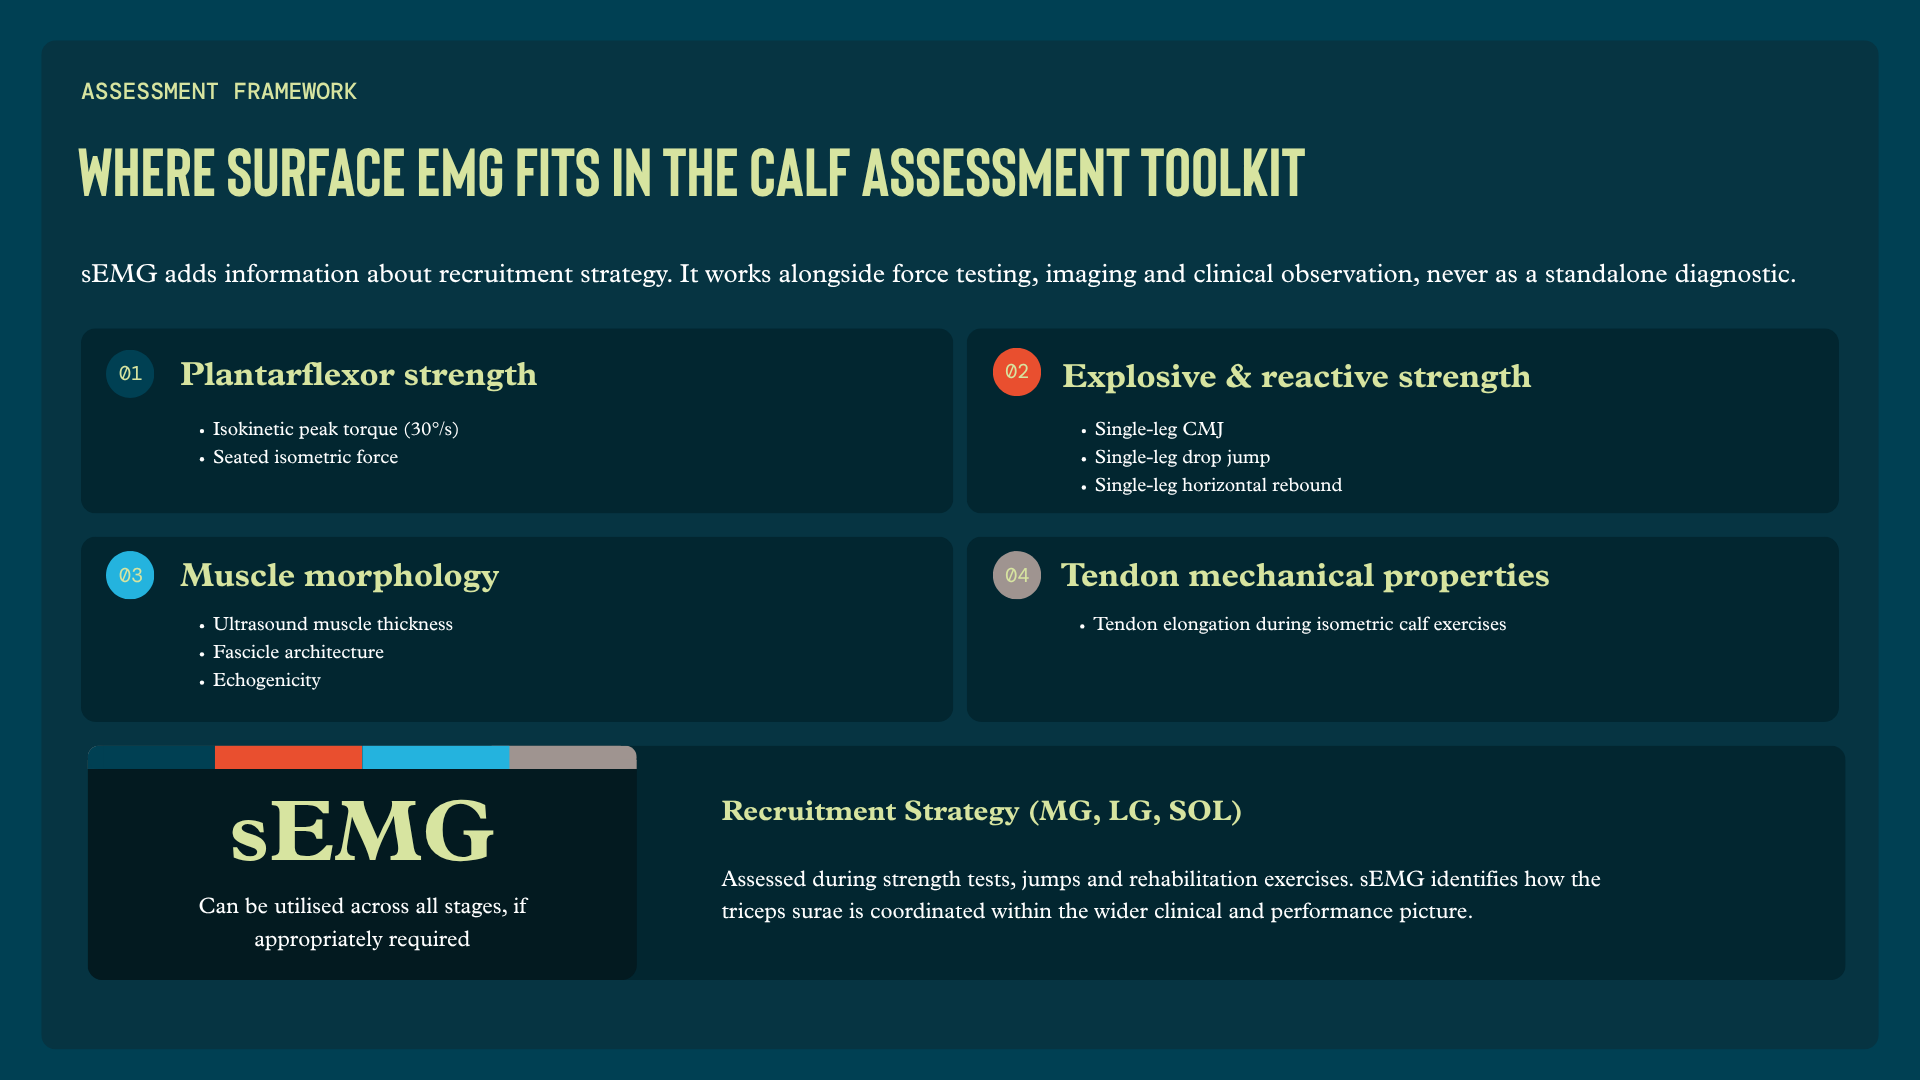
Within a session, with consistent electrode placement confirmed by ultrasound, compare MG, LG, and SOL relative to each other and, where possible, to the contralateral limb.
The relevant finding is the pattern: which muscle contributes less, whether that pattern holds across tasks of different demand and speed, and whether it shifts with fatigue. Again, raw amplitude values across individuals or sessions have limited value. Within a single session, with MVIC reference collected under the same conditions, peak and normalised amplitude comparisons are reliable enough for clinical decision-making.
Tweet ThisThe relevant finding is the pattern: which muscle contributes less, whether that pattern holds across tasks of different demand and speed, and whether it shifts with fatigue.
@colingriffin
Case 1: Persistent SOL deficit following MG strain
A professional footballer with a history of left MG strain and subsequent plantaris-related Achilles symptoms presented with consistent left sided asymmetry across multiple domains.
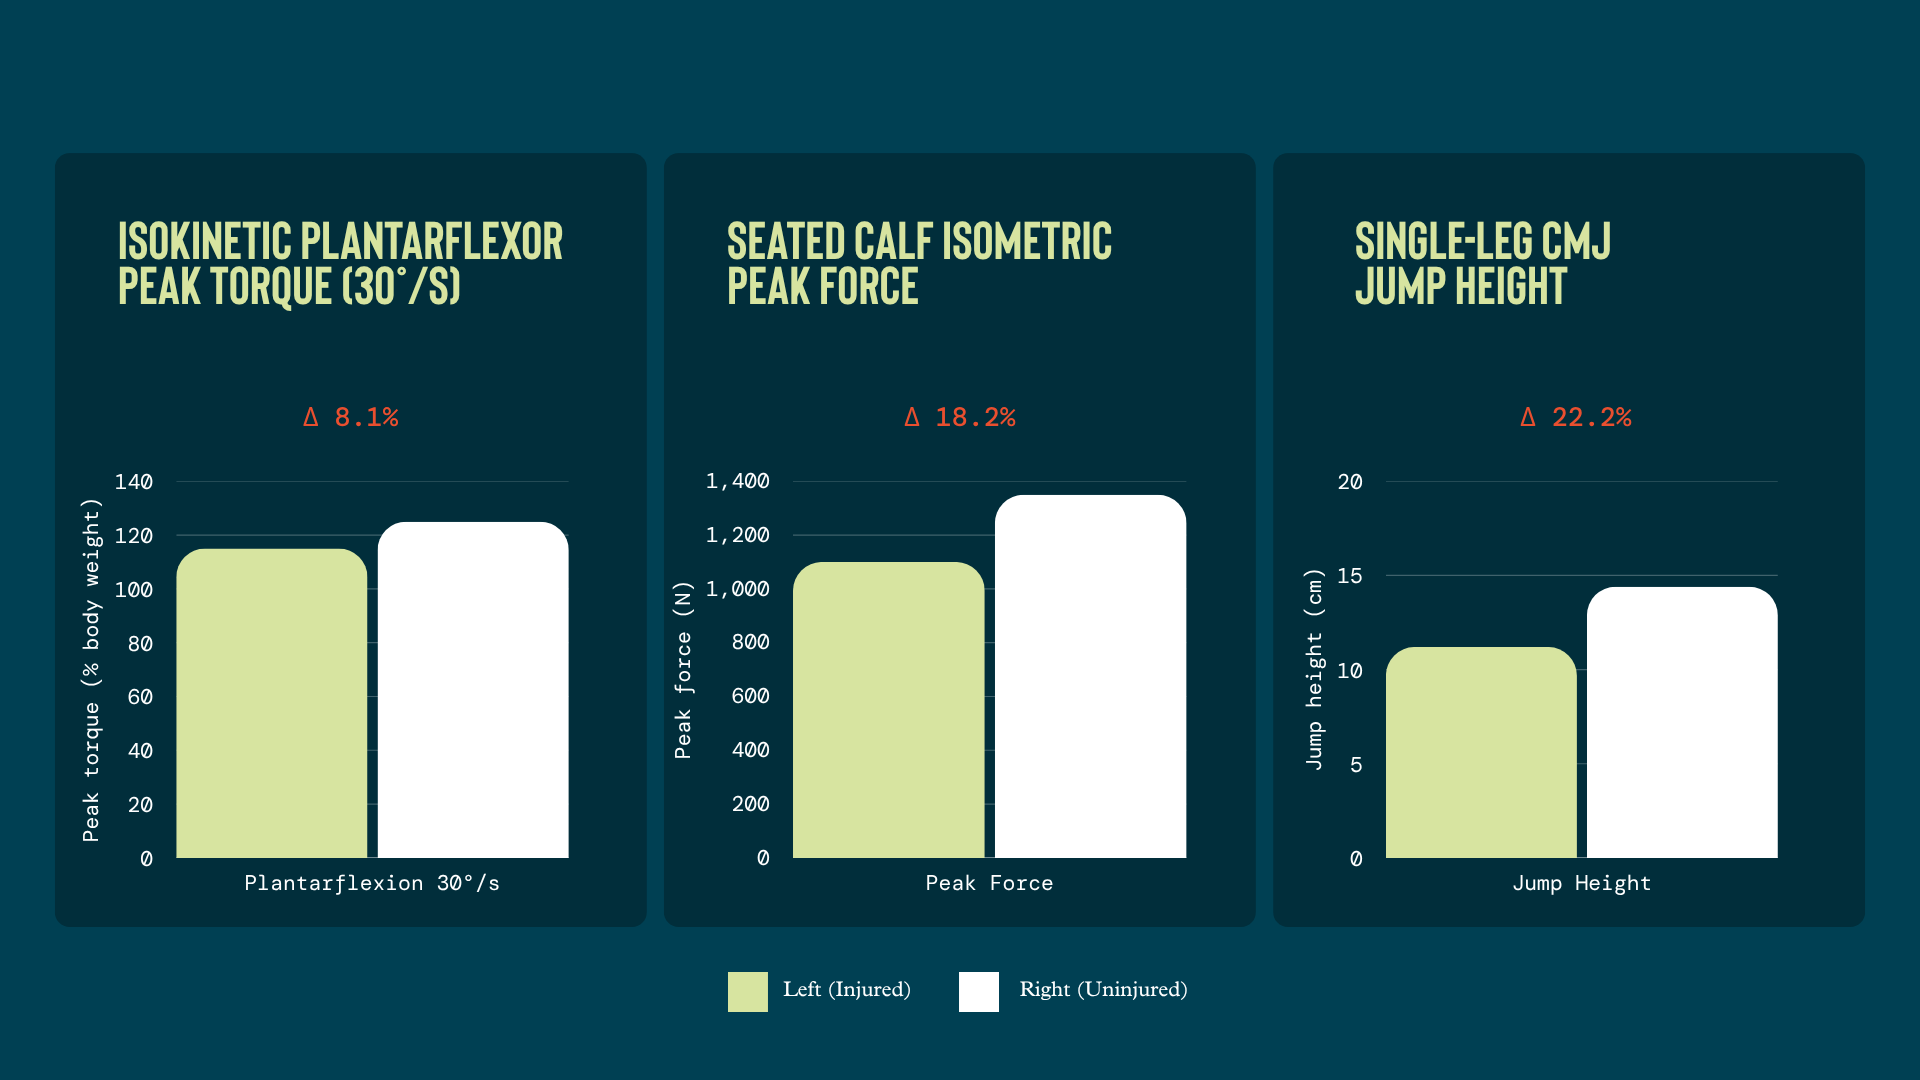
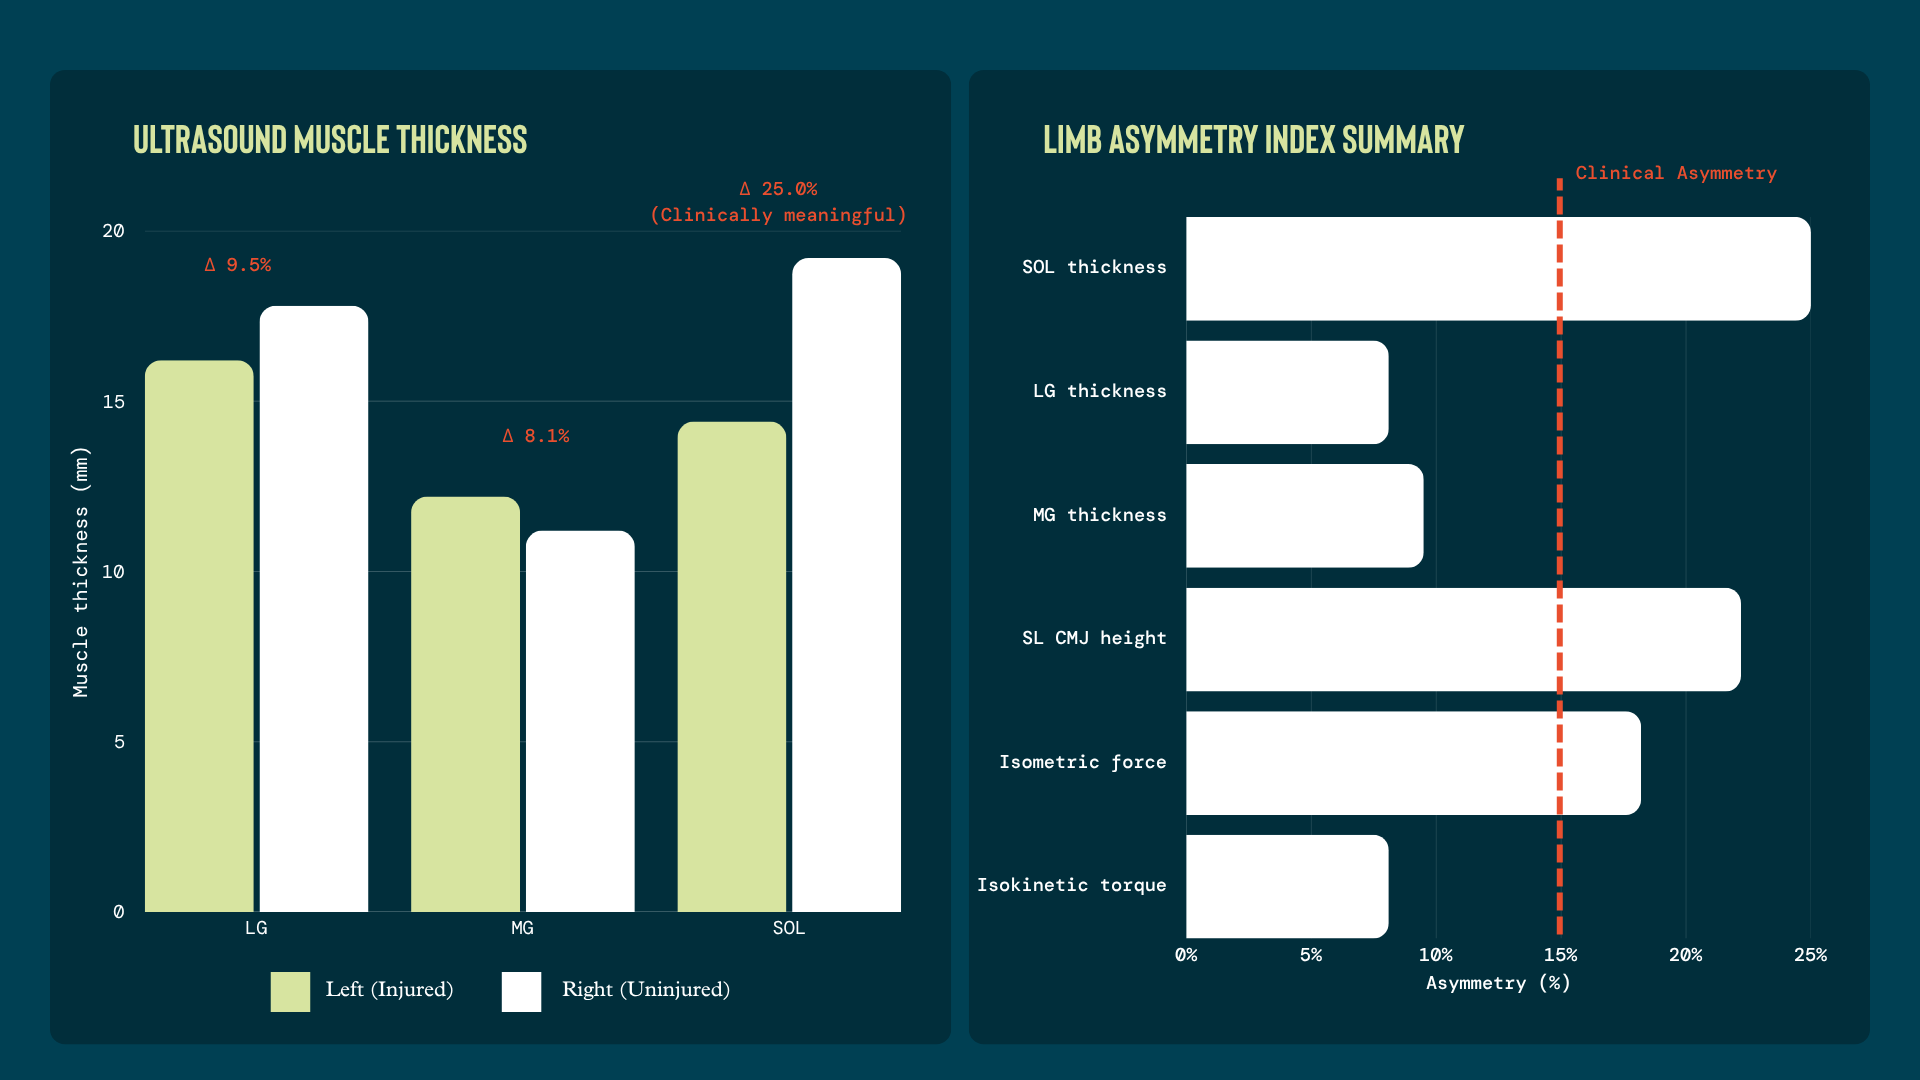
Seated isometric calf force was approximately 18–20% lower on the left. On ultrasound, SOL thickness measured 14.4 mm left vs. 19.2 mm right (25% asymmetry). Single-leg CMJ was 11.2 cm left vs. 14.4 cm right; drop jump 7.5 vs 9.4 cm. Isokinetic peak torque showed a more modest asymmetry by comparison.
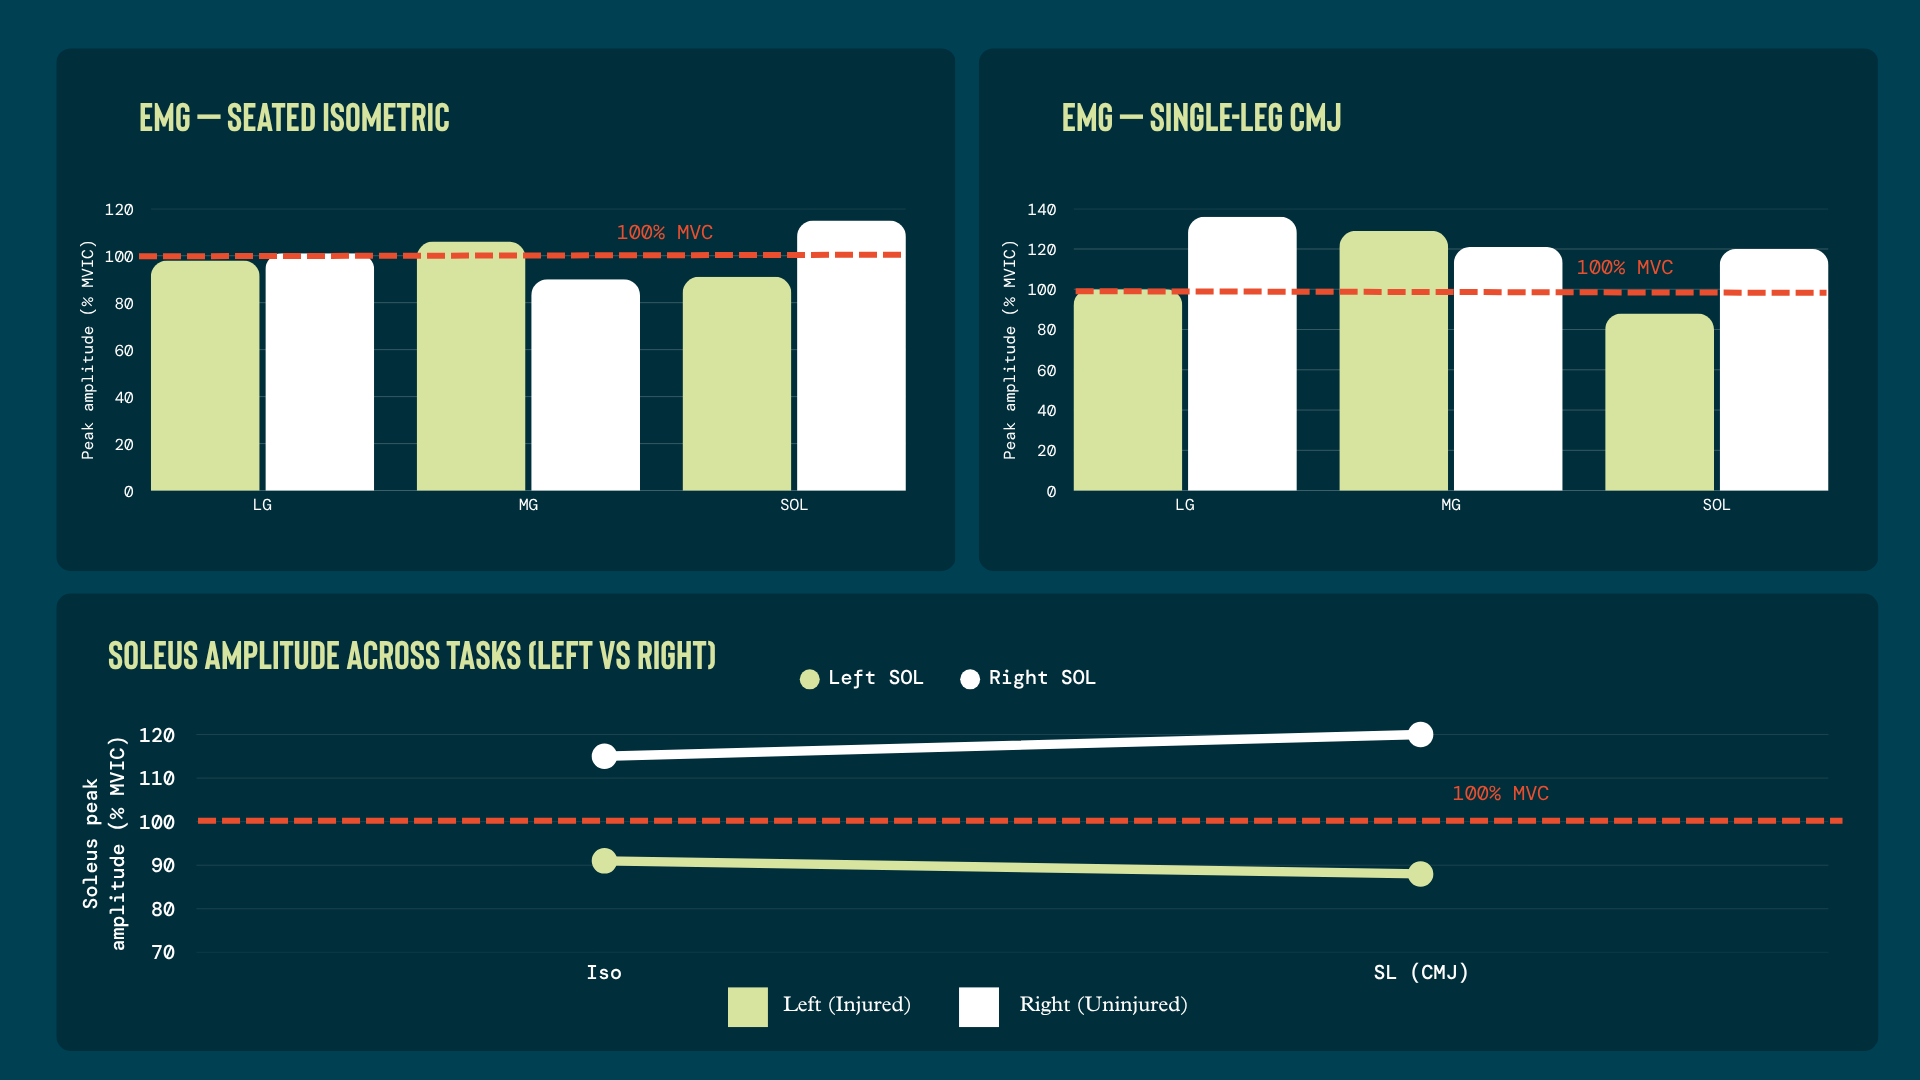
The sEMG profile showed lower SOL amplitude on the left with relatively higher MG contribution, the inverse of Nielsen’s compensatory pattern, and more consistent with a longer-standing drift away from SOL loading. It’s a reminder that recruitment strategy is individual, not fixed, and needs to be tested rather than assumed.
The convergence of force, morphological, and EMG data directed the programme towards progressive SOL-specific loading: knee-flexed positions and graduated plyometric exposure, with sEMG tracking whether SOL contribution increased as load progressed.
Case 2: Reduced MG contribution during explosive tasks
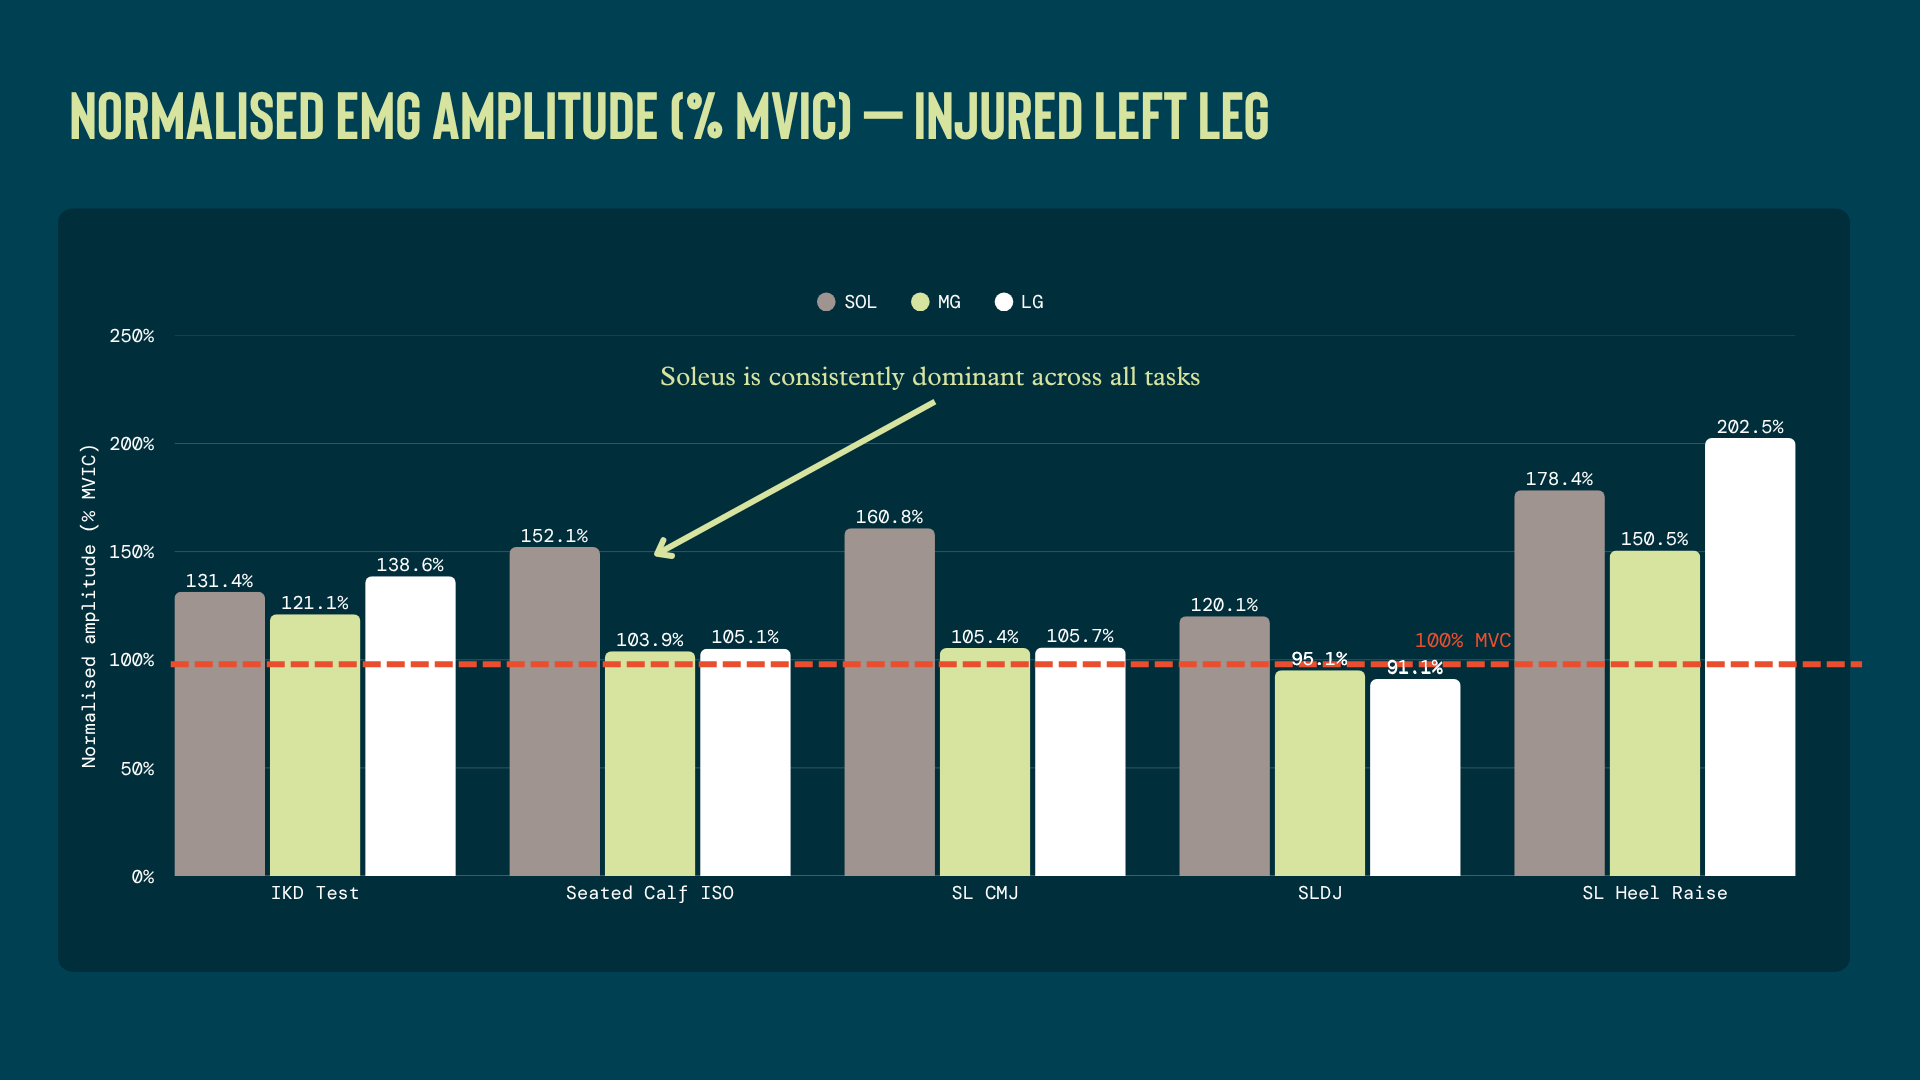
This athlete had a left calf strain involving the medial soleus, with a prior history of MG strains. sEMG showed SOL amplitude consistently exceeding MG across every task: SL CMJ (160.8% vs 105.4% MVIC), seated isometric (152.1% vs 103.9%), and SL heel raise (178.4% vs 150.5%).
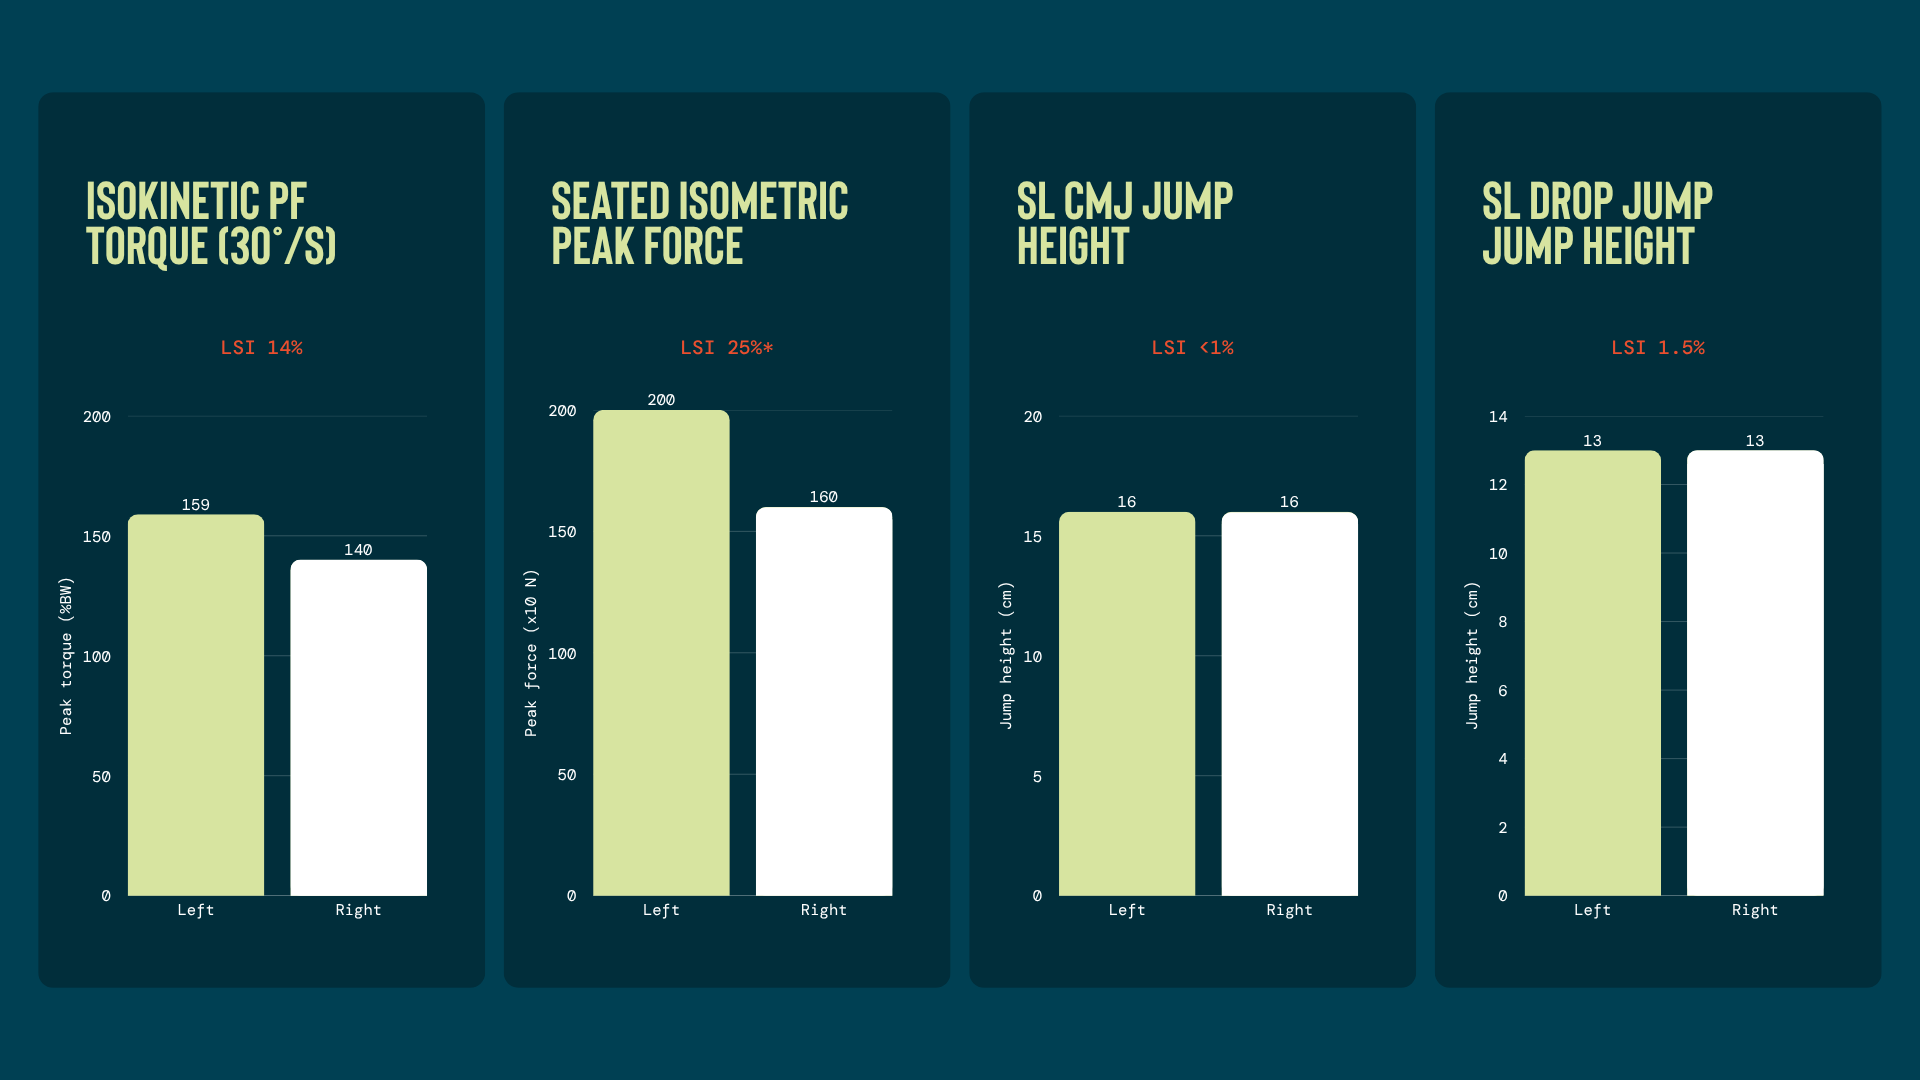
Notably, performance on the injured side was not compromised: SL CMJ and drop jump height were near-symmetric (0.6% and 1.5% asymmetry, respectively). The left leg actually produced higher isokinetic dynamometry (IKD) peak torque (159% vs. 140% bodyweight) and seated isometric force (199.6% vs 159.6%) than the uninjured right.
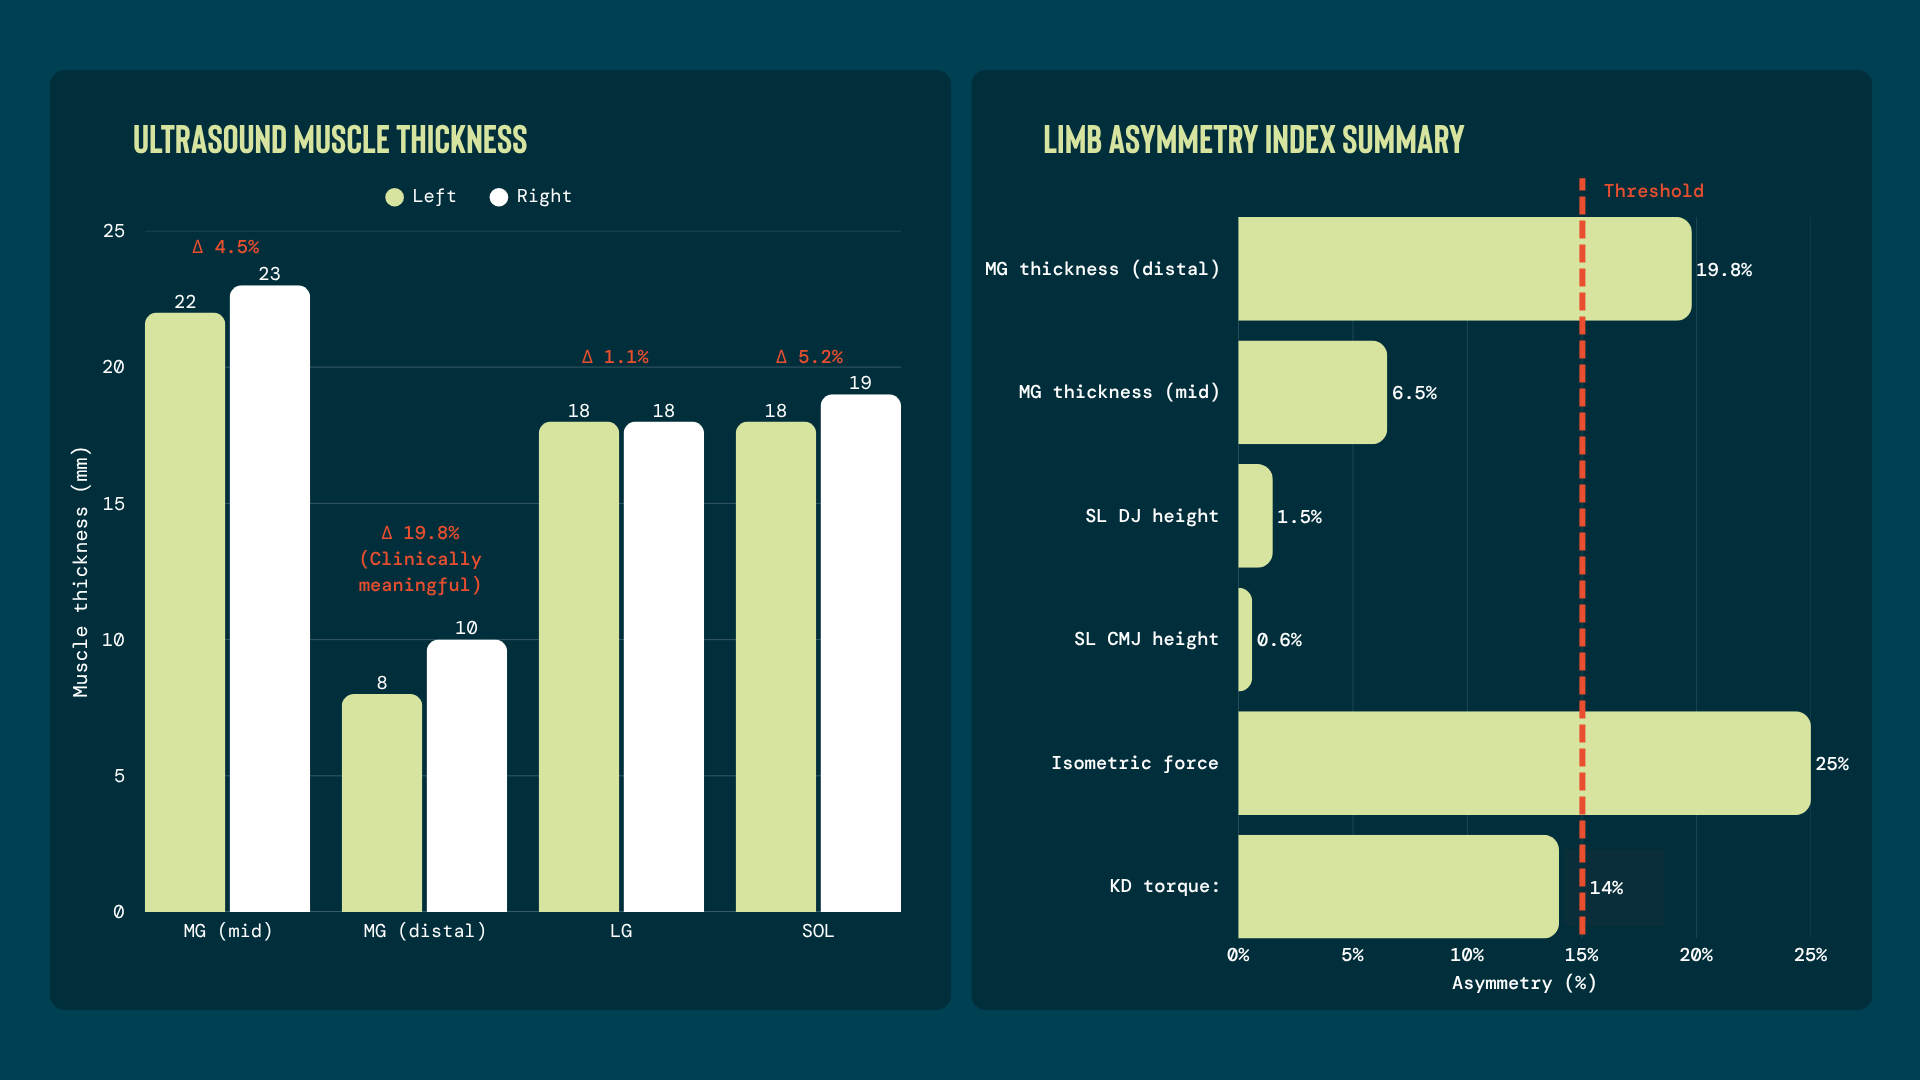
The one clear asymmetry was structural, 19.8% reduced distal MG thickness on the left, alongside the consistently SOL-dominant recruitment strategy.
This is a good example of why aggregate force and jump metrics can mask an altered recruitment strategy entirely. On strength and jump testing alone, this athlete would look fully recovered, even superior, on the injured side. Only the muscle-specific EMG and ultrasound data reveal that the left calf is achieving comparable output by leaning heavily on SOL and, indeed, the LG, while MG remains structurally and neurally under-contributing.
The programme prioritised MG-specific loading: knee-extended plantarflexion positions with an externally rotated foot to bias gastrocnemius recruitment. The MG:SOL ratio and serial MG thickness were reassessment markers, rather than force or jump metrics that were already within normal limits.
Tweet ThisThe programme prioritised MG-specific loading: knee-extended plantarflexion positions with an externally rotated foot to bias gastrocnemius recruitment. The MG:SOL ratio and serial MG thickness were reassessment markers rather than force or jump metrics.
@colingriffin
Case 3: Reduced LG contribution in mid-portion Achilles tendinopathy
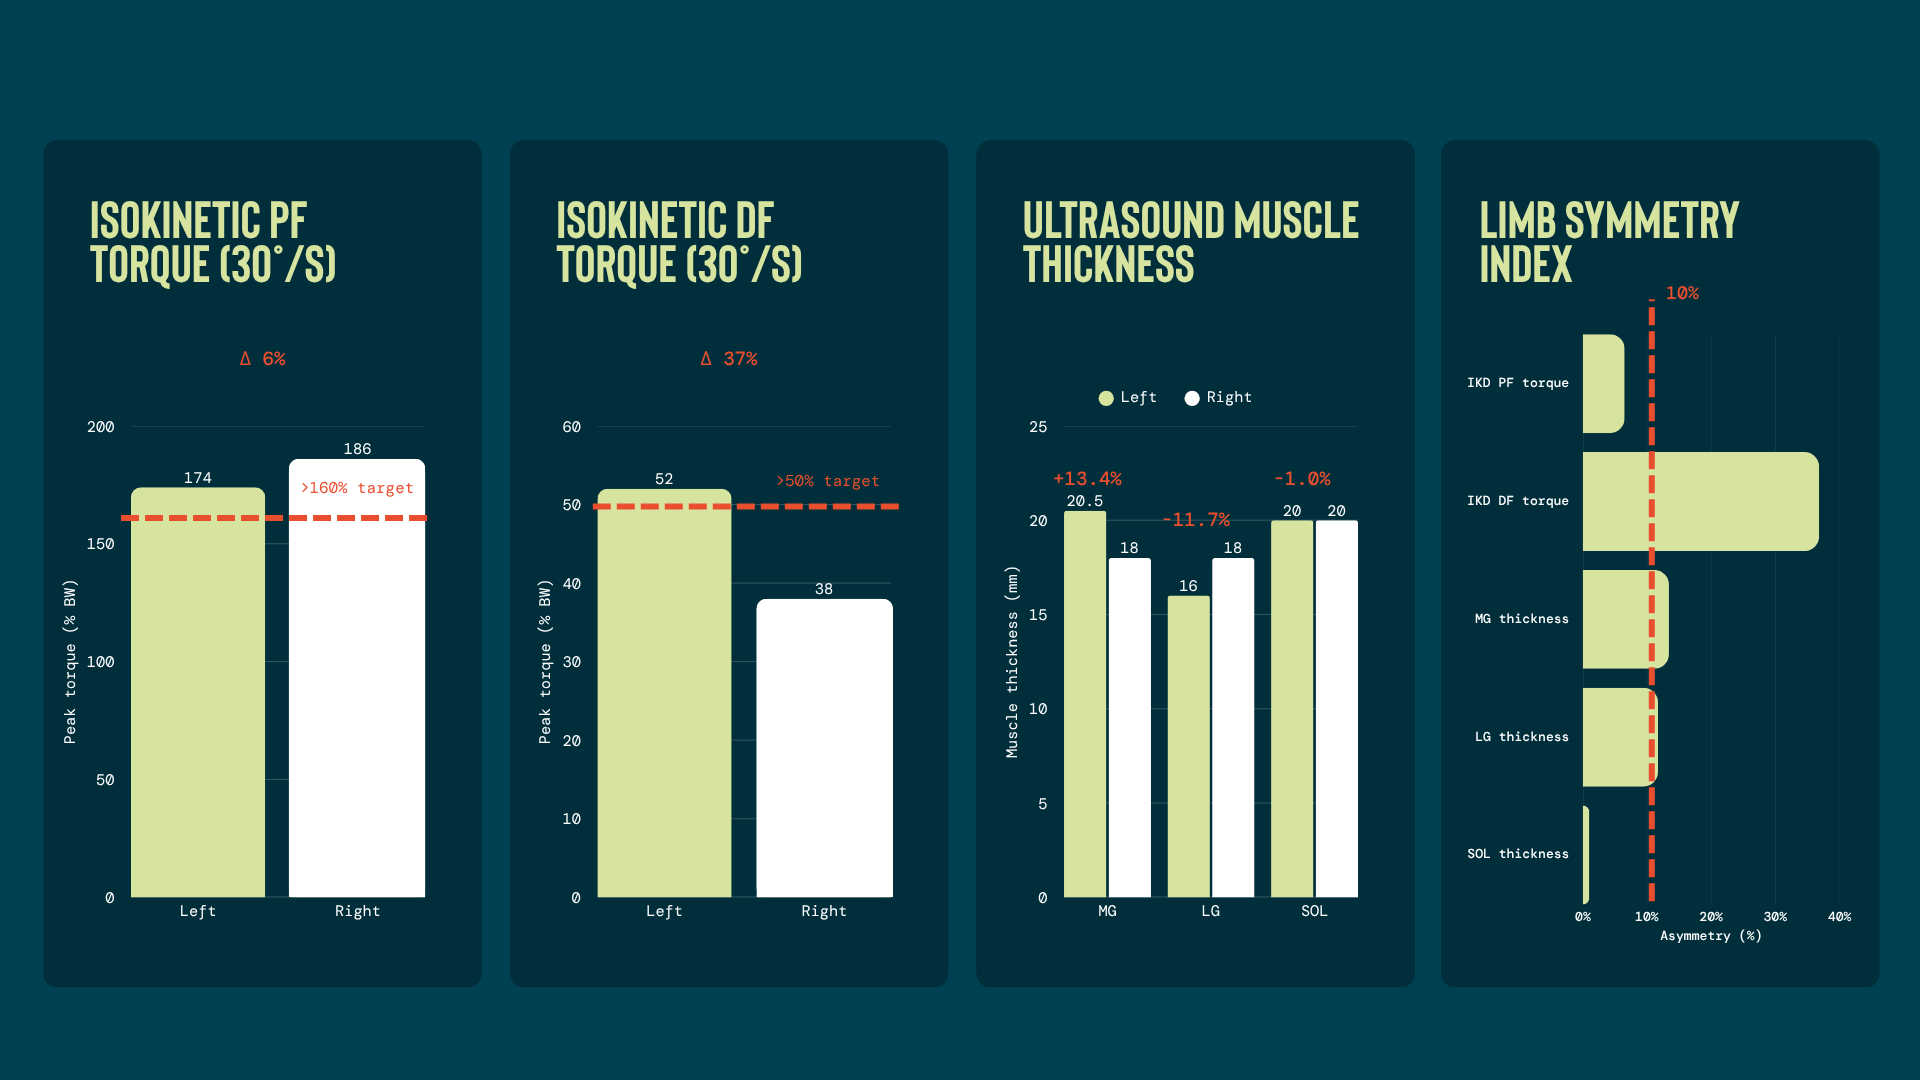
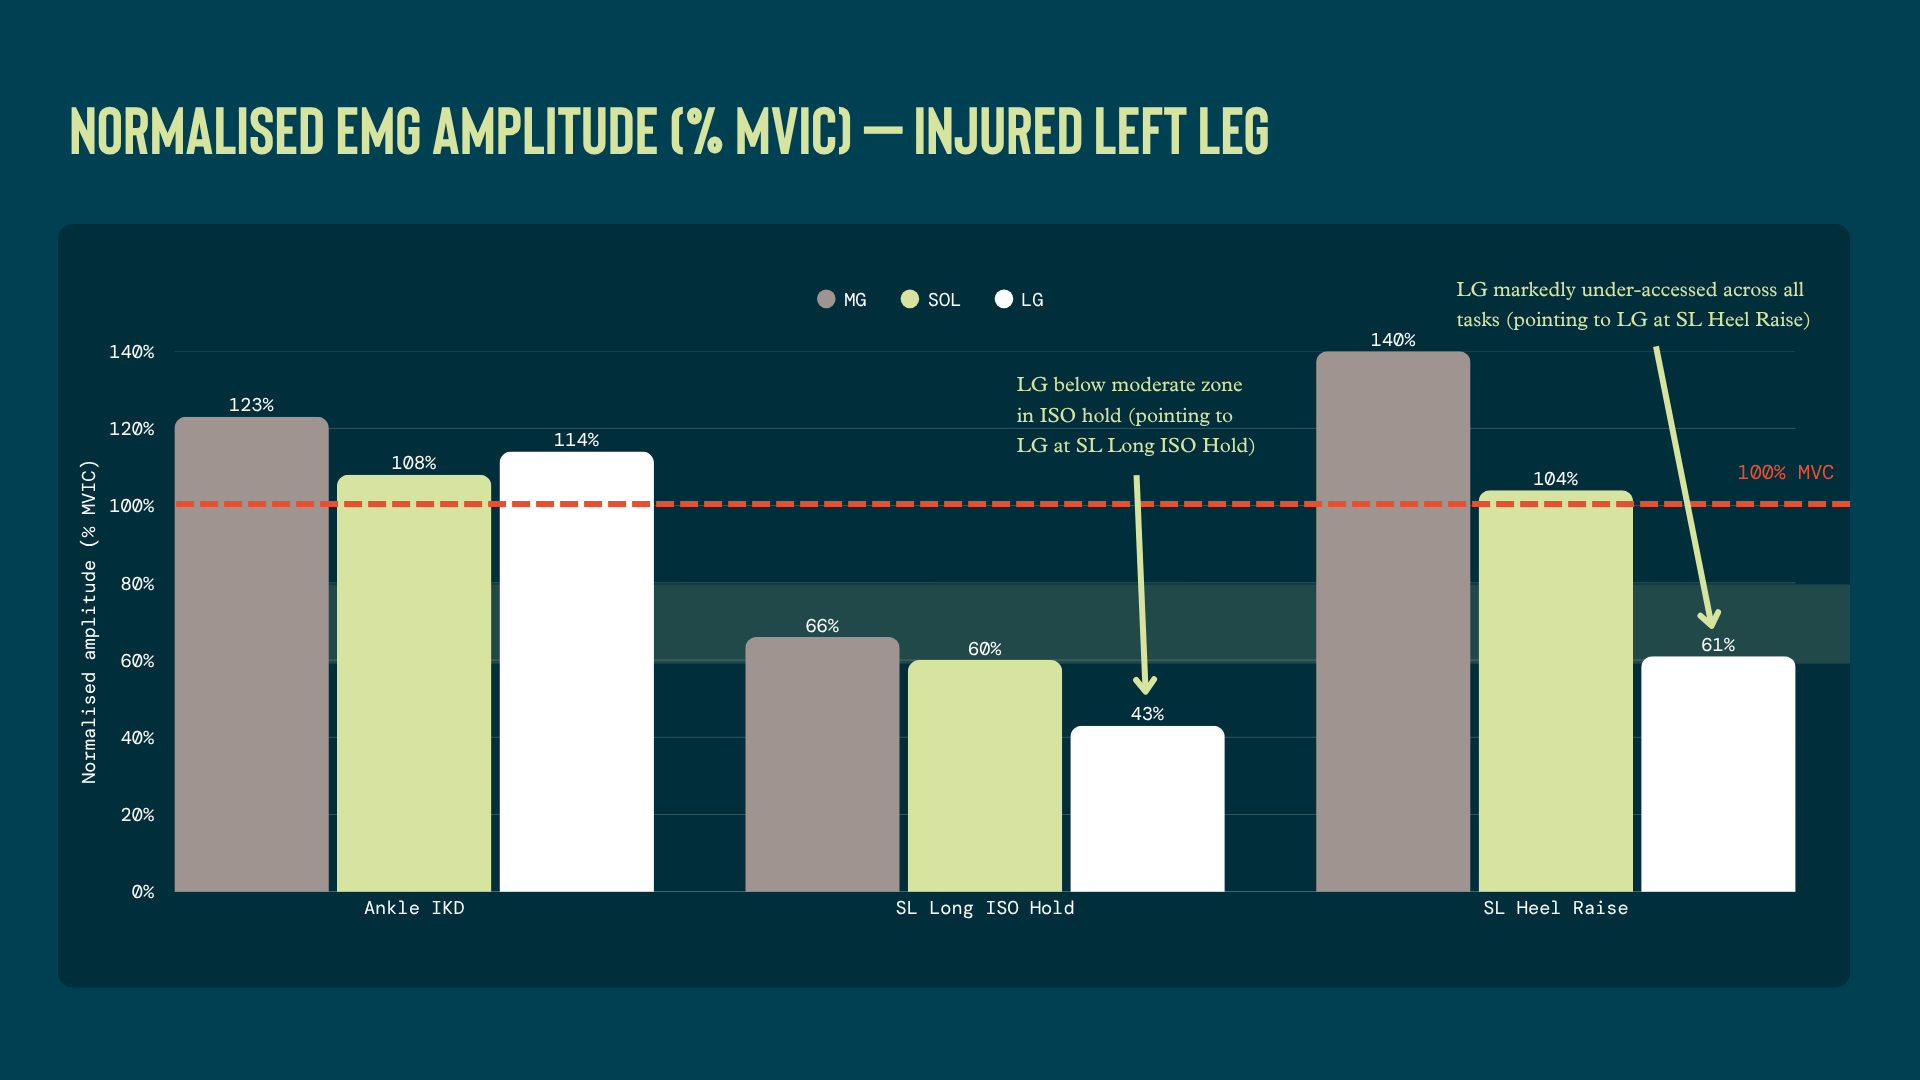
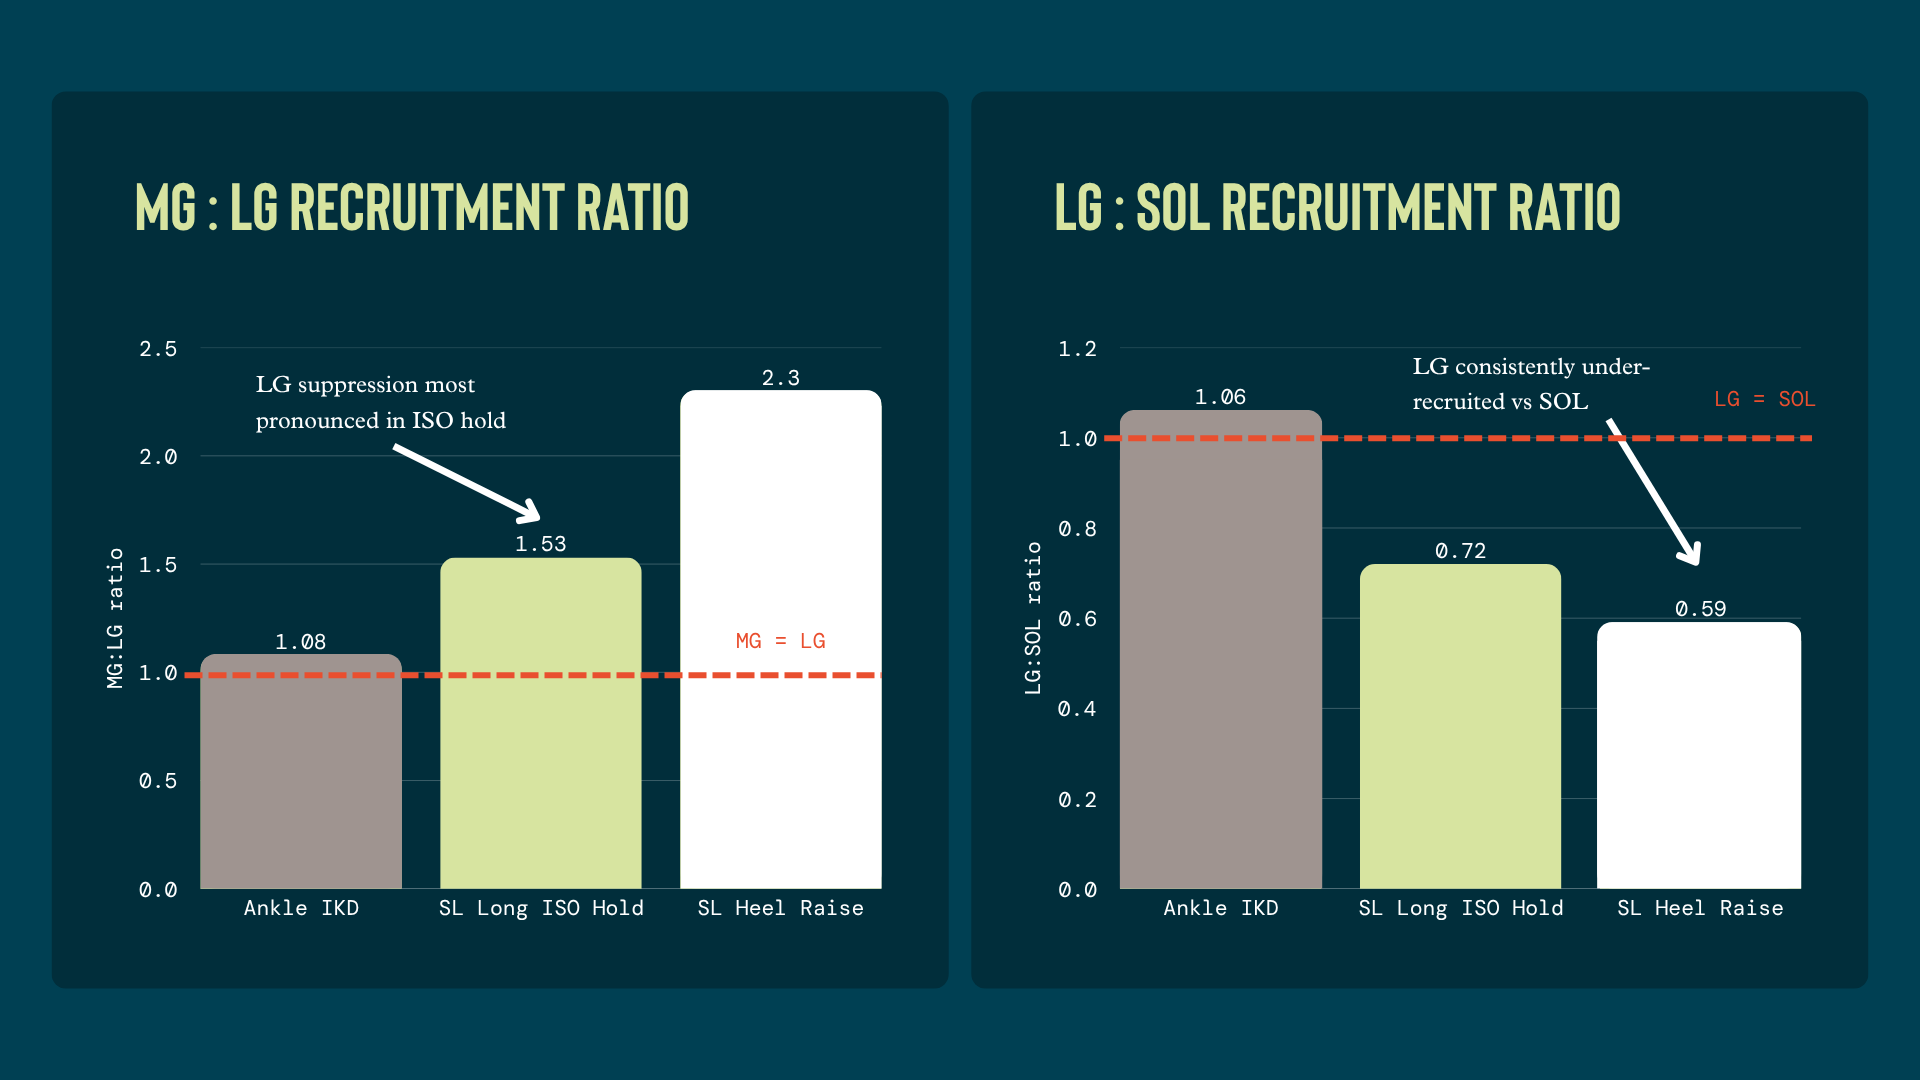
An athlete with mid-portion Achilles tendinopathy produced near-MVC or supra-MVC LG peaks during maximal dynamic testing, but showed less consistent LG contribution across functional and sustained tasks.
During a 30-repetition heel raise, the athlete had MG 115% MVC, SOL 131% MVC, and LG 108% MVC. A 30-second isometric hold had SOL 90%, MG 66%, LG 71%, with LG showing greater variability and apparent fatigue across the hold relative to the other two muscles.
This reflects what the literature is beginning to describe more clearly: maximum activation capacity may be preserved while habitual recruitment under functional load is altered.[7]
The programme included progressive LG loading through straight knee calf raises working into dorsiflexion with an internally-rotated foot. Where standard exercise variation did not reliably shift LG amplitude upward, neuromuscular electrical stimulation augmented LG drive alongside voluntary loading.
Exercise selection and biofeedback: Test, don’t assume
The ability to modify relative recruitment through exercise selection is real, but it is not predictable.
Knee position is a useful starting point. With the knee flexed, the gastrocnemius is mechanically disadvantaged and relative SOL contribution tends to increase. With the knee extended, the reverse. But research and experience shows that peak triceps surae activity during MVIC is not reliably linked to specific knee flexion angles.[10] The relationship is not consistent enough to apply as a rule.
Foot position may shift the balance between MG and LG. But again, the EMG response is not universal.
Very often, the same foot orientation that produces a clear LG response in one athlete has no appreciable effect in another. This is an important distinction from the structural adaptations seen with selective loading. Selective hypertrophy and architectural change in response to foot position appear consistent in the literature, but the acute EMG response is not.
My approach is to test variations, foot position, load, range, tempo, and use sEMG to identify which, if any, produces the target response in that individual.
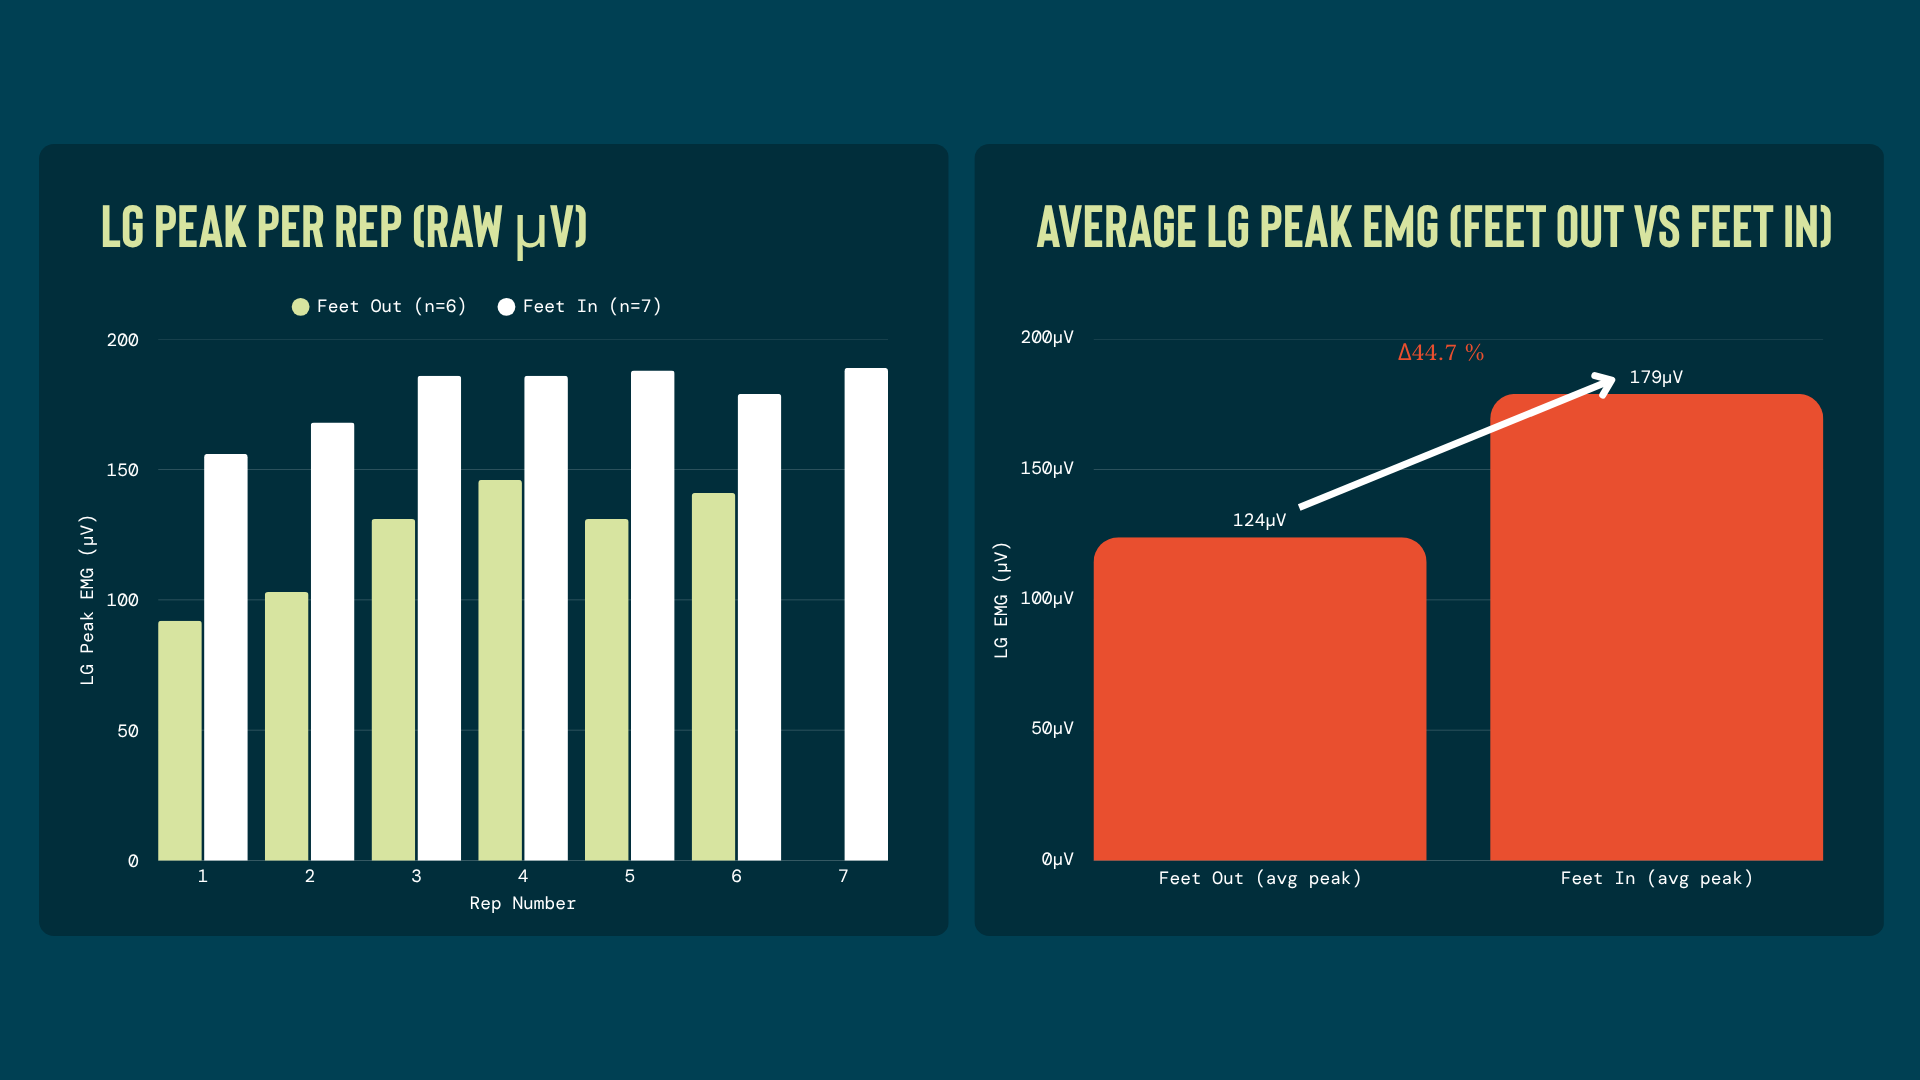
Where nothing works reliably, NMES becomes a more prominent part of the plan. Internally rotating the feet and pushing through the lateral column of the foot can increase LG activation.
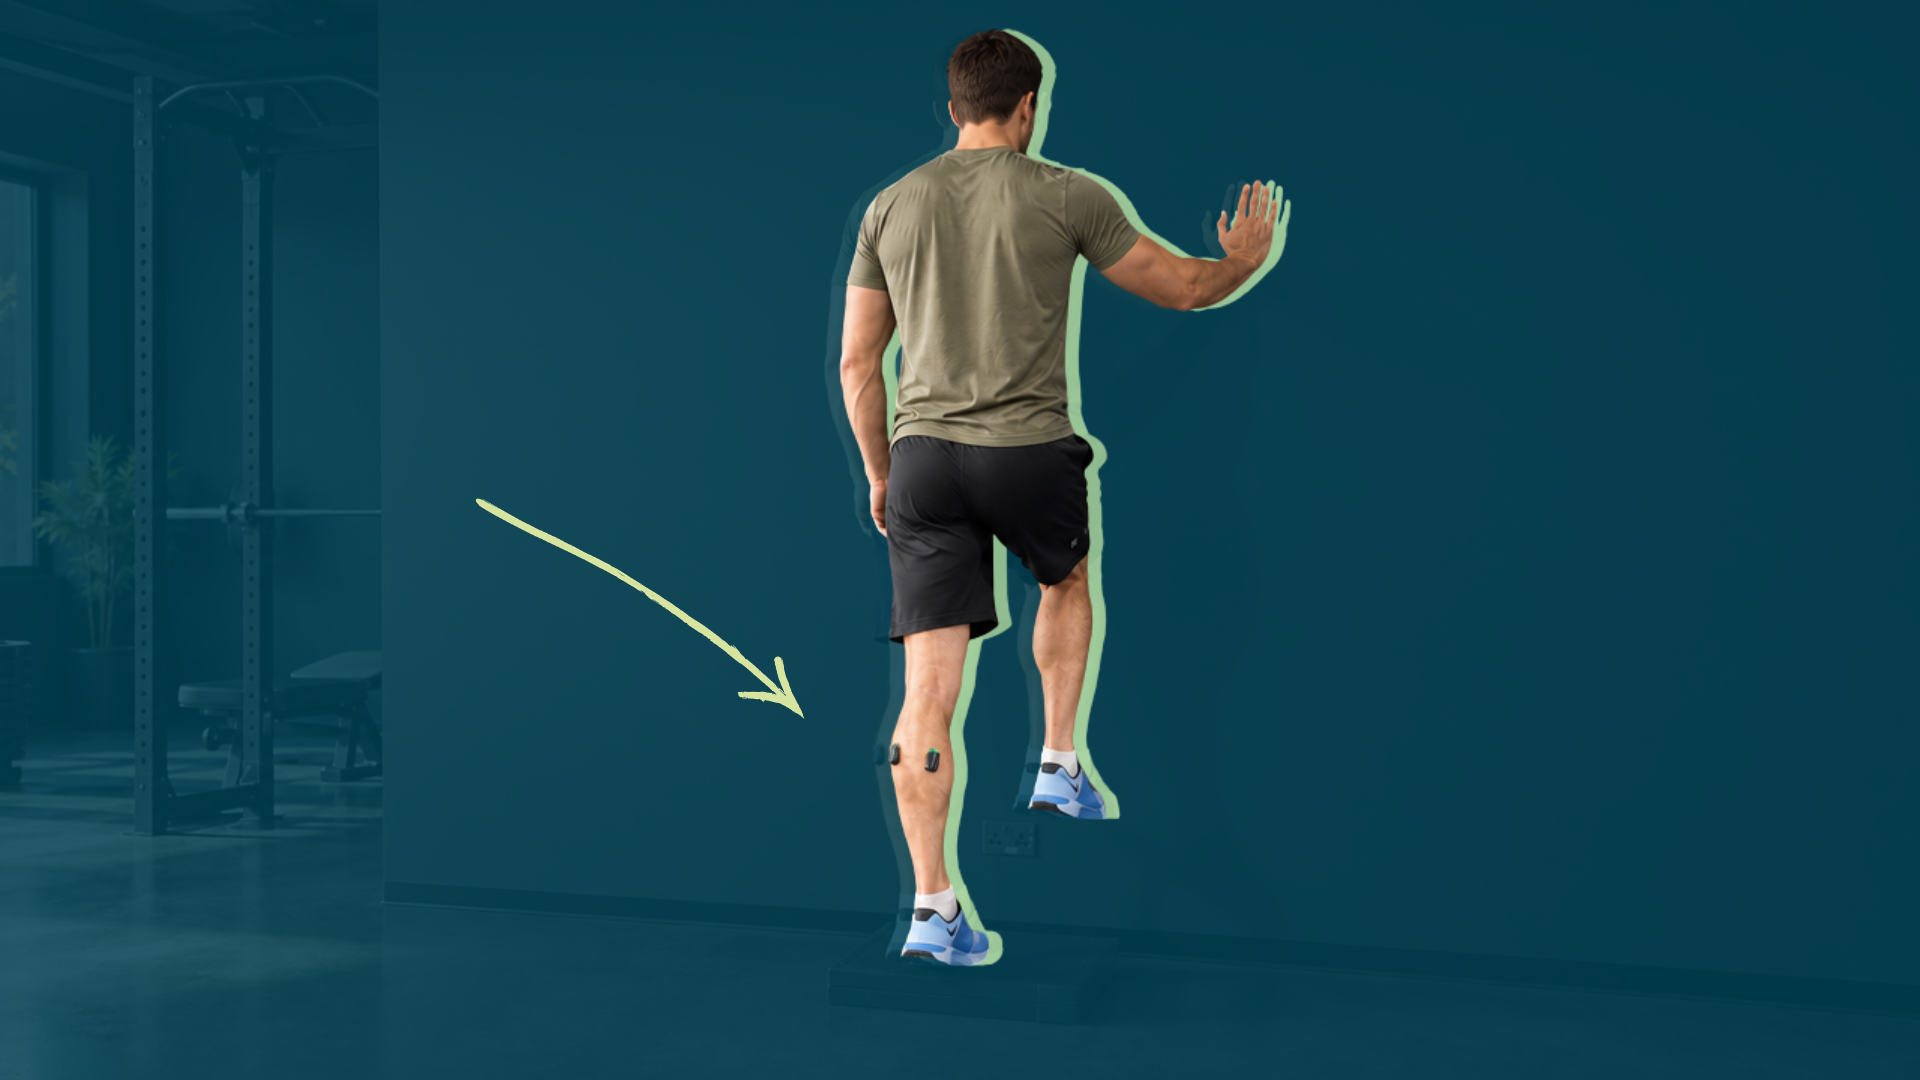
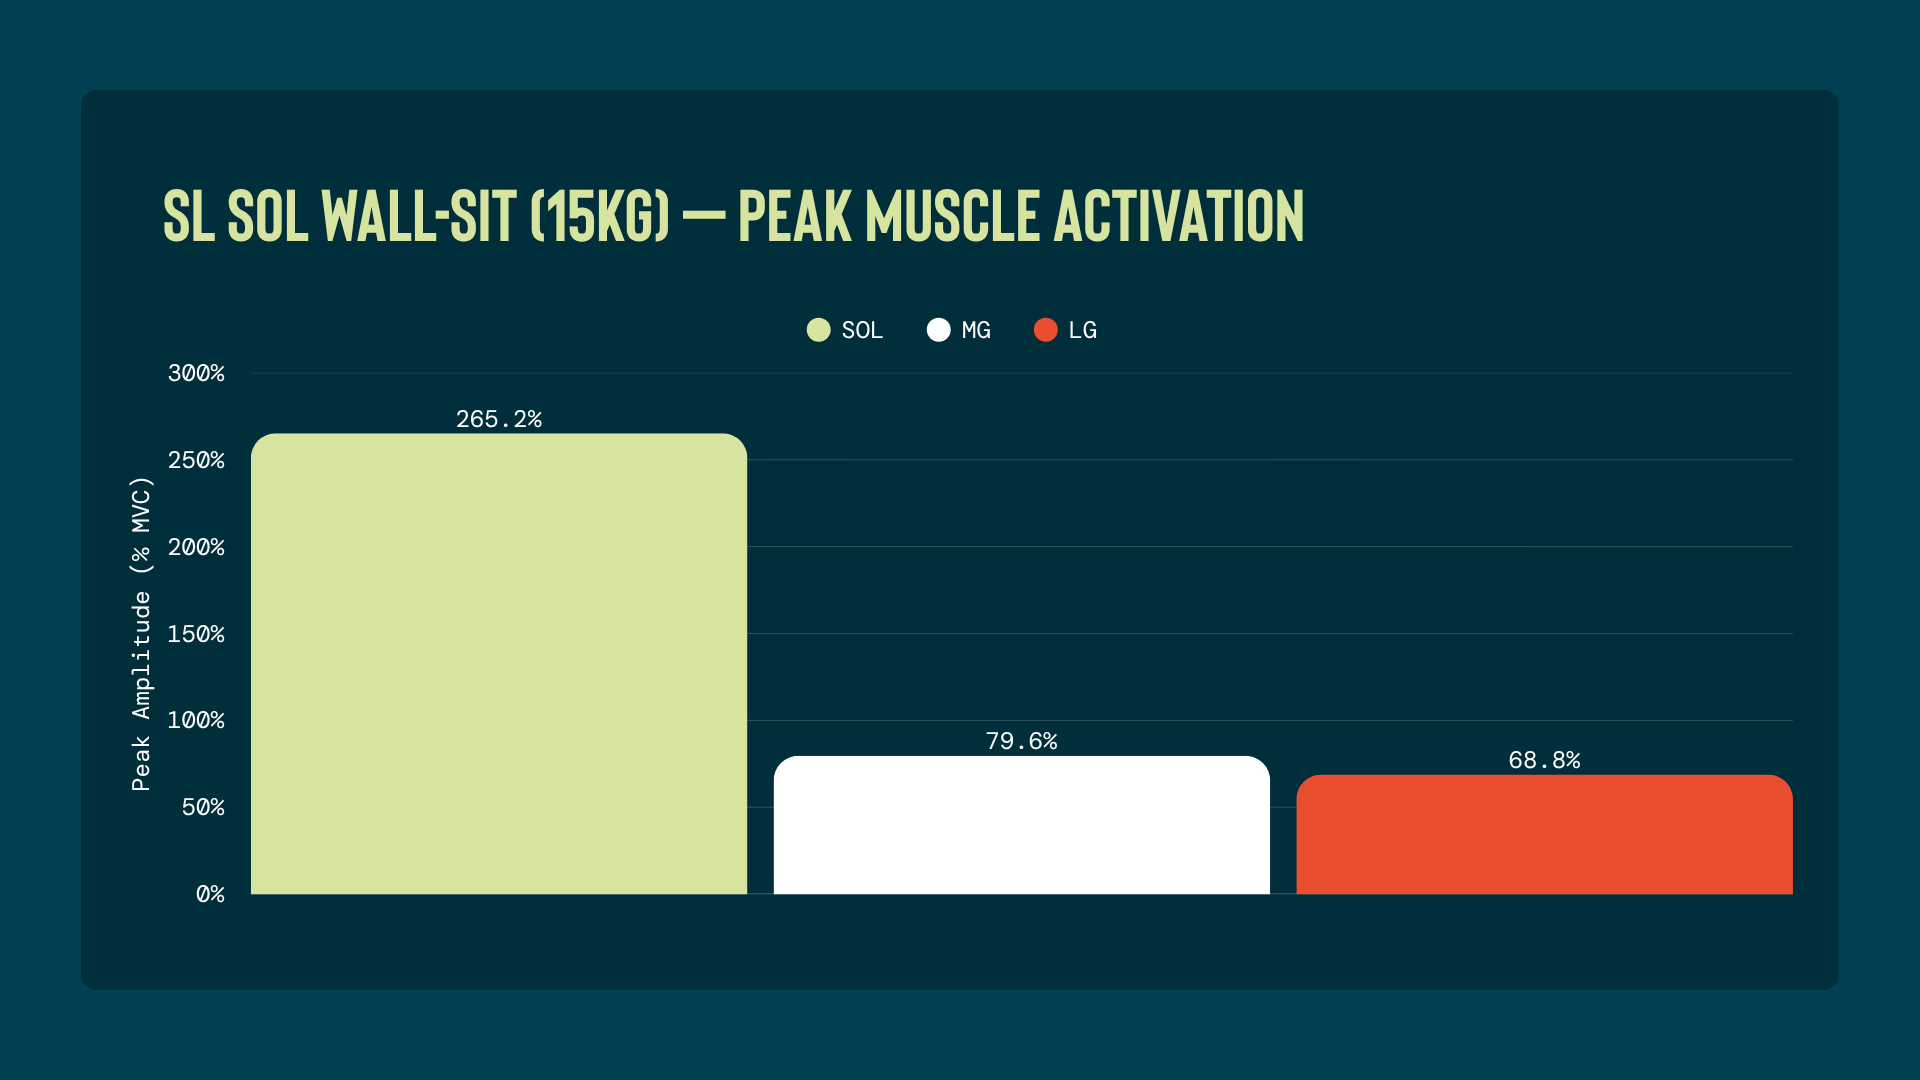
The most effective approach for isolating SOL from the gastrocnemii combines plantarflexion with simultaneous knee extension demand, what I describe practically as a soleus wall-sit.
Adding voluntary isometric knee extension to plantarflexion significantly depressed MG activity while increasing SOL activity, exploiting the antagonist function of the biarticular gastrocnemius during knee extension.[11,12] Knee flexion alone reduces gastrocnemius contribution but does not fully isolate the SOL.[10] The knee extension element gives a more consistent SOL-dominant response than flexion alone.
In Video 2, an athlete performs a “soleus wall-sit” with 15kg external load, showing a clearly isolated soleus activation strategy relative to the gastrocnemii. SOL amplitude here notably exceeds 100% MVC, likely reflecting both the added load driving SOL beyond the unloaded MVC demand and the possibility that the MVC trial did not fully capture maximal soleus activation.
Tweet ThisThe most effective approach for isolating SOL from the gastrocnemii combines plantarflexion with simultaneous knee extension demand, what I describe practically as a soleus wall-sit.
@colingriffin
Surface EMG asks different questions than other tools: which muscles are actually doing the work, and in what proportion? Those questions matter in a group of structures where three muscles with different functions share a common tendon and can be driven independently.
The cases here illustrate why a generic “the calf” approach falls short.
MG strain, Achilles tendinopathy, and Achilles rupture each leave a different recruitment signature, sometimes matching the pattern described in the literature, sometimes not. That inconsistency is the point: individual variation is real, and it is only visible when you assess each muscle rather than assuming a fixed compensation pattern.
Aggregate force or torque data will not show you this. Only muscle-specific data will.
With careful electrode placement, consistent normalisation, and the discipline to read the EMG alongside force and imaging data rather than in isolation, it is a genuinely useful addition to the assessment toolkit, particularly for uncovering the muscle-specific legacy that a previous injury has left behind.