
The Performance Rehabilitation team is a centralised athlete health service within the UK Sports Institute. Our mission is to support optimal rehabilitation across the UK high performance system. We want athletes to come back physically and psychologically stronger, and we help the high performance system achieve this.
One of the tools we’ve embedded into our practice is 3D motion capture. This is a way for us to provide a deep contextual assessment of movement when addressing complex rehabilitation questions.
This article shares the rationale, the process, and the challenges of using 3D motion capture in a rehab setting—and what we’ve learned so far. The mini-case studies illustrate different scenarios in which 3D motion capture supported rehab decision-making: reinforcing a clinical suspicion, revealing something unexpected, and offering reassurance that progress is on track.
Tweet ThisOne of the tools we’ve embedded into our practice is 3D motion capture. This is a way for us to provide a deep contextual assessment of movement when addressing complex rehabilitation questions.
@Adammattiussi
Motion capture vs. motion analysis
Rehabilitation has always involved some level of movement analysis, but traditional approaches—observation, video, and clinical assessment—can only take us so far. 3D motion capture offers a detailed, objective view of joint kinetics and kinematics. Practitioners can use these to understand segmental coordination, interlimb asymmetries, and longitudinal change.
However, the sheer volume of data 3D motion capture produces can become a burden. Without a clear purpose or interpretation strategy, it risks becoming a distraction.
The full value of 3D motion capture lies in its ability to: support or challenge clinical impressions; reveal compensatory strategies that may not be visible to the naked eye; quantify changes over time; add confidence to decision-making when clearing an athlete for the next stage of their rehab; and influence exercise prescription.
These benefits only emerge when biomechanics is embedded within the wider clinical and physical picture. A truly multidisciplinary approach is essential.
Contexts shape the questions
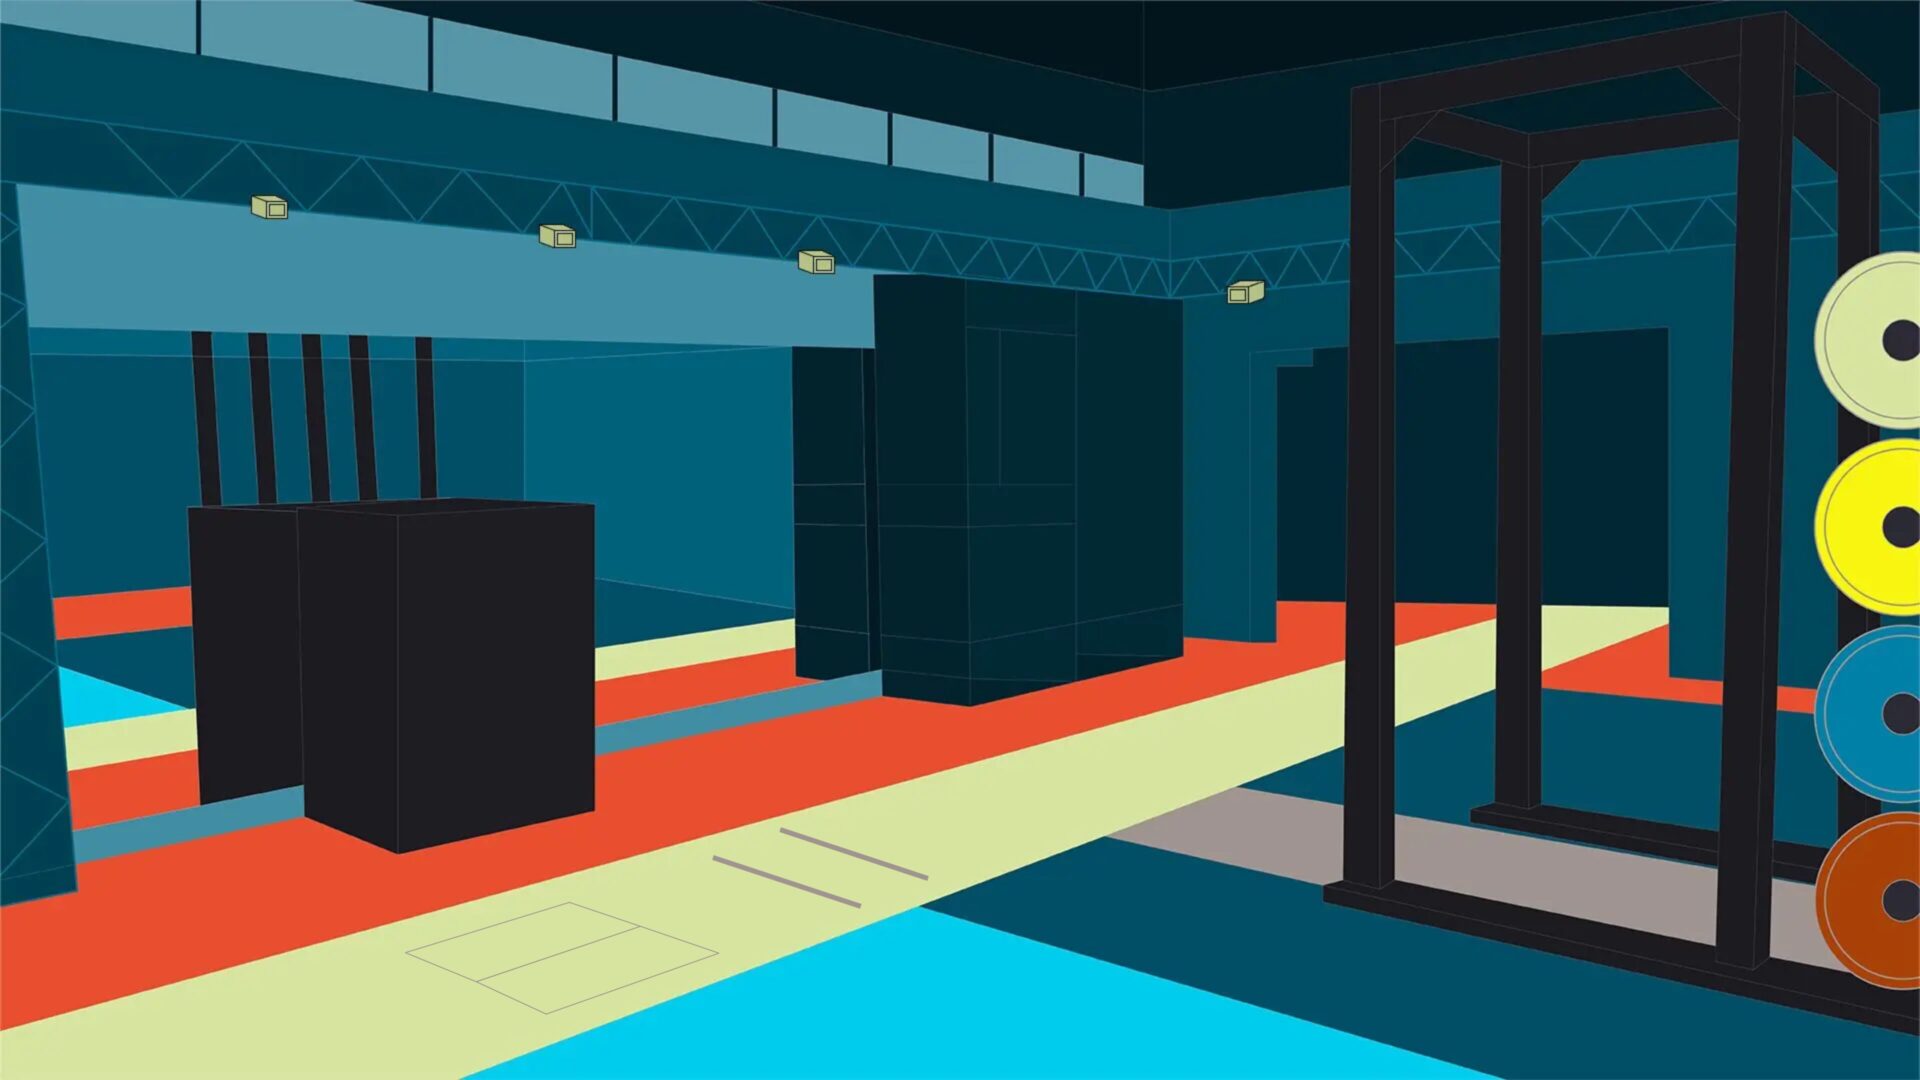
Our 3D motion capture system fits into a system where athletes can seamlessly transition between sessions, whether they are bed-based, gym-based, or assessment-based (Figure 2). We use an 18-camera Qualisys system (16 optical and two video), integrated with dual Kistler force plates.
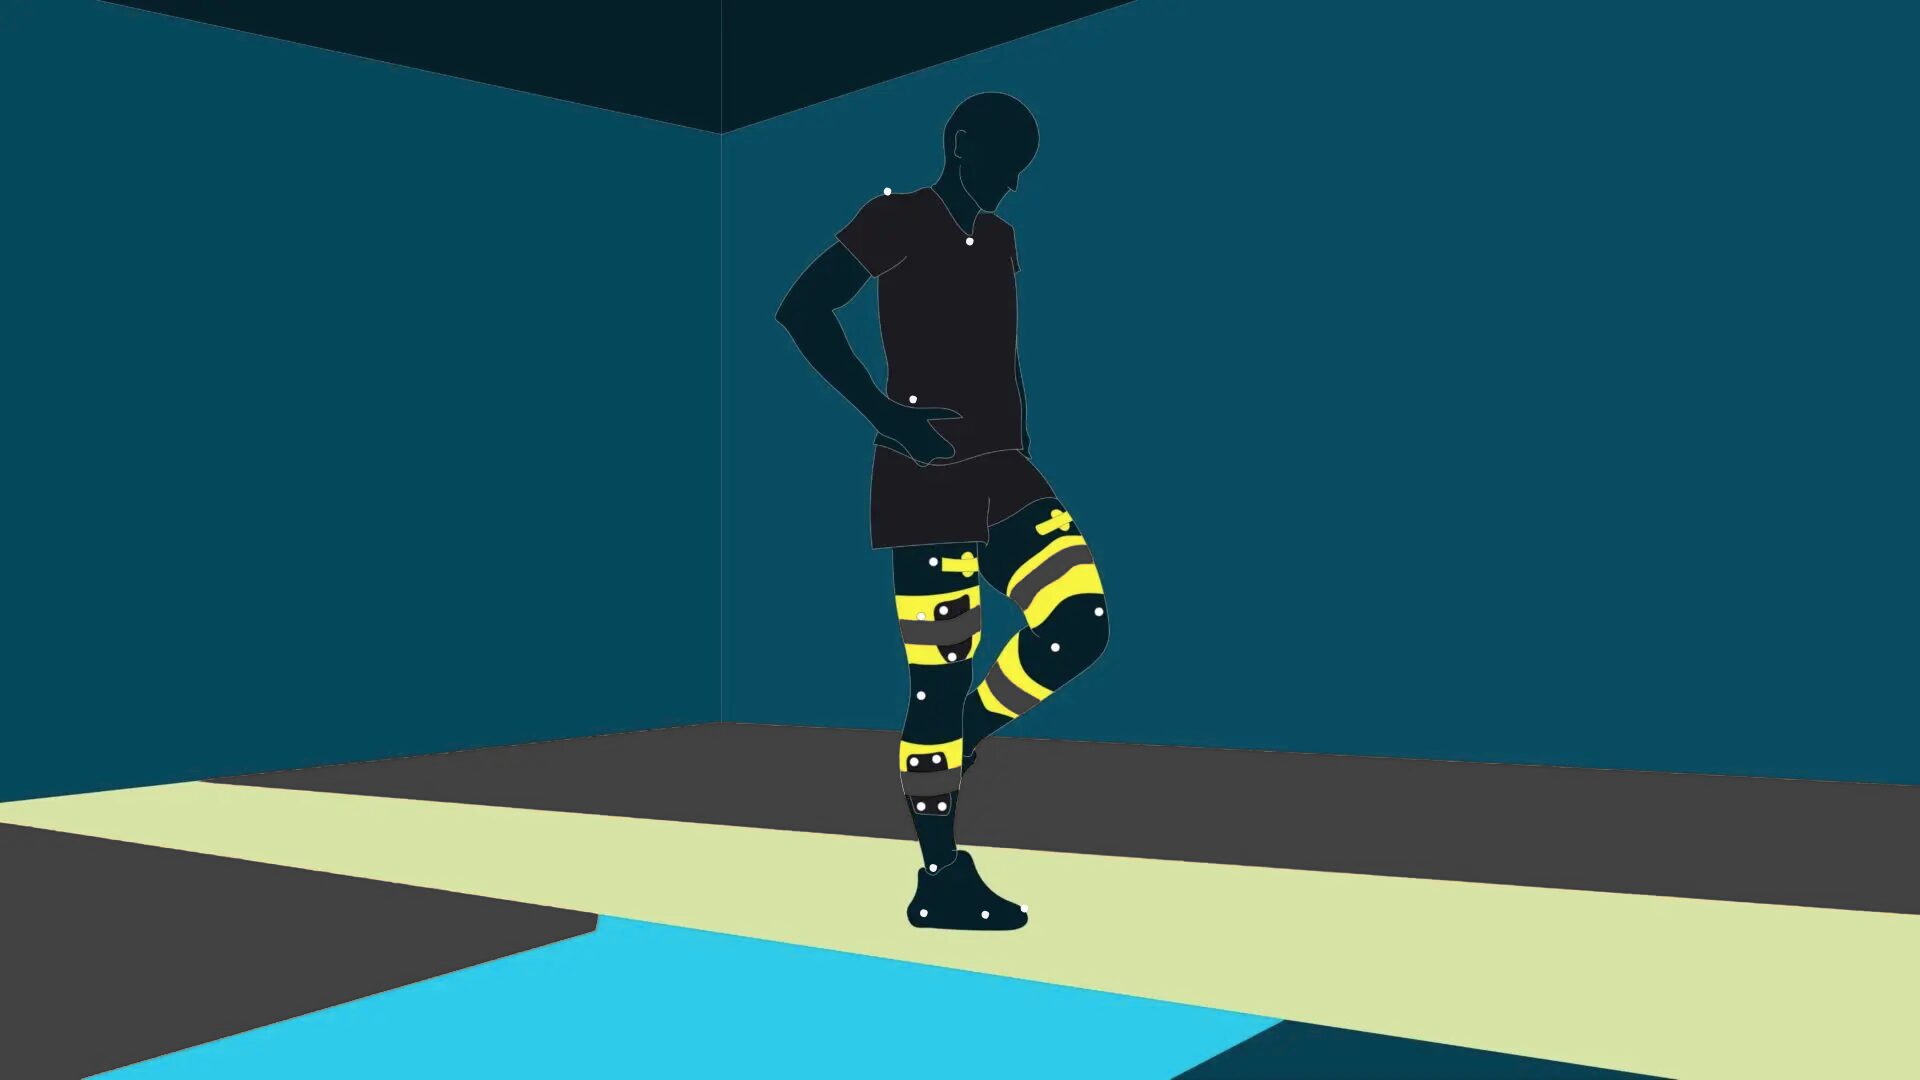
A typical session lasts between 60 and 120 minutes, which includes a warm-up, marker placement, test familiarisation, and test trials.
A biomechanist and either an S&C coach or a physiotherapist deliver these sessions. This helps us maintain consistency in data capture and ensure the sessions run smoothly.
Our process is heavily influenced by our context. Because we take only a few athletes per week, we perform individualized analysis followed by bespoke reporting and communication of information upon discharge. An environment that sees a much higher volume of athletes may opt to take a more uniform approach to reporting information.
One of the most important principles we’ve learned is to start with a question.
Biomechanical testing can generate hundreds of variables per trial. Without a clear question to guide analysis, you risk creating noise rather than signal. Examples might include:
- “Is the athlete showing frontal plane knee control during single leg jumping tasks post-ACL reconstruction?”
- “Are we seeing asymmetries in ankle joint mechanics following a lateral ankle sprain during a 10-5 pogo?”
- “Are we seeing any compensatory strategies in their segmental coordination?”
- “Is this athlete offloading their knee during a maximal single-leg isometric squat?”
A clear question shapes everything, including task selection, metric prioritisation, and feedback delivery.
Tweet ThisOur 3D motion capture system fits into a system where athletes can seamlessly transition between sessions. We use an 18-camera Qualisys system (16 optical and two video), integrated with dual Kistler force plates.
@Adammattiussi
Choosing the movements to capture
Once the question is clear, we build the assessment around it. Our task selection depends on the athlete’s stage of rehabilitation, clinical presentation, and the physical qualities we’re trying to evaluate (Figure 3).
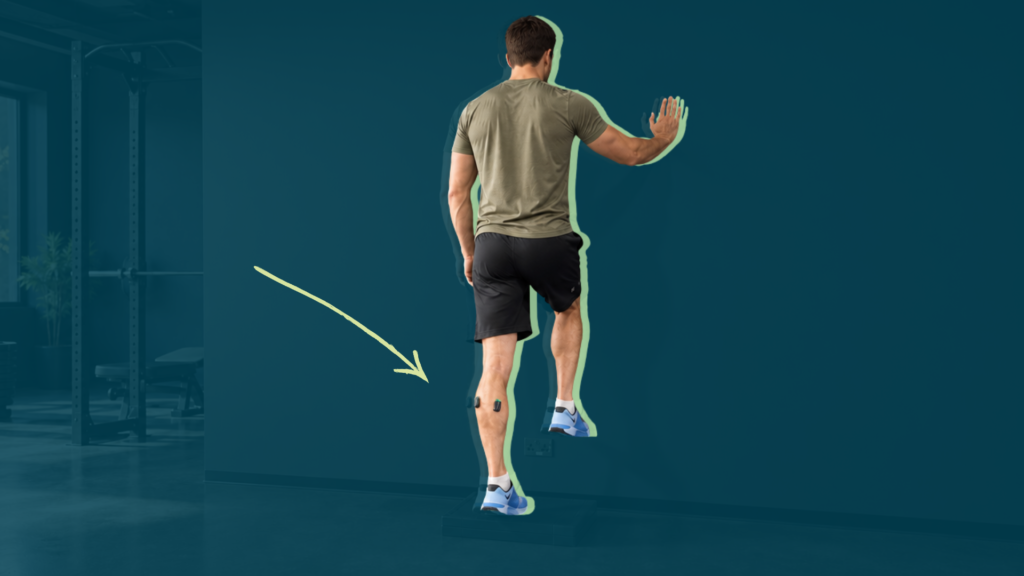
Common dynamic tasks include countermovement jumps, 10-5 pogo jumps, drop landings, and anterior and lateral hop and sticks. We also incorporate isometric force testing, typically favouring the single leg isometric squat, single leg standing plantarflexion, and single leg seated plantarflexion. We have also assessed single leg balance.
Some sport-specific tasks we’ve assessed are a snatch balance with a weightlifter, single leg jumping on a trampoline with a gymnast, and a continuous slide board with a speed skater.
We aim to identify tests that bias a specific joint to understand potential compensations or deficits. This might include a 10-5 pogo for an ankle injury or a single leg isometric squat for a knee injury.
Moving data in a useful direction
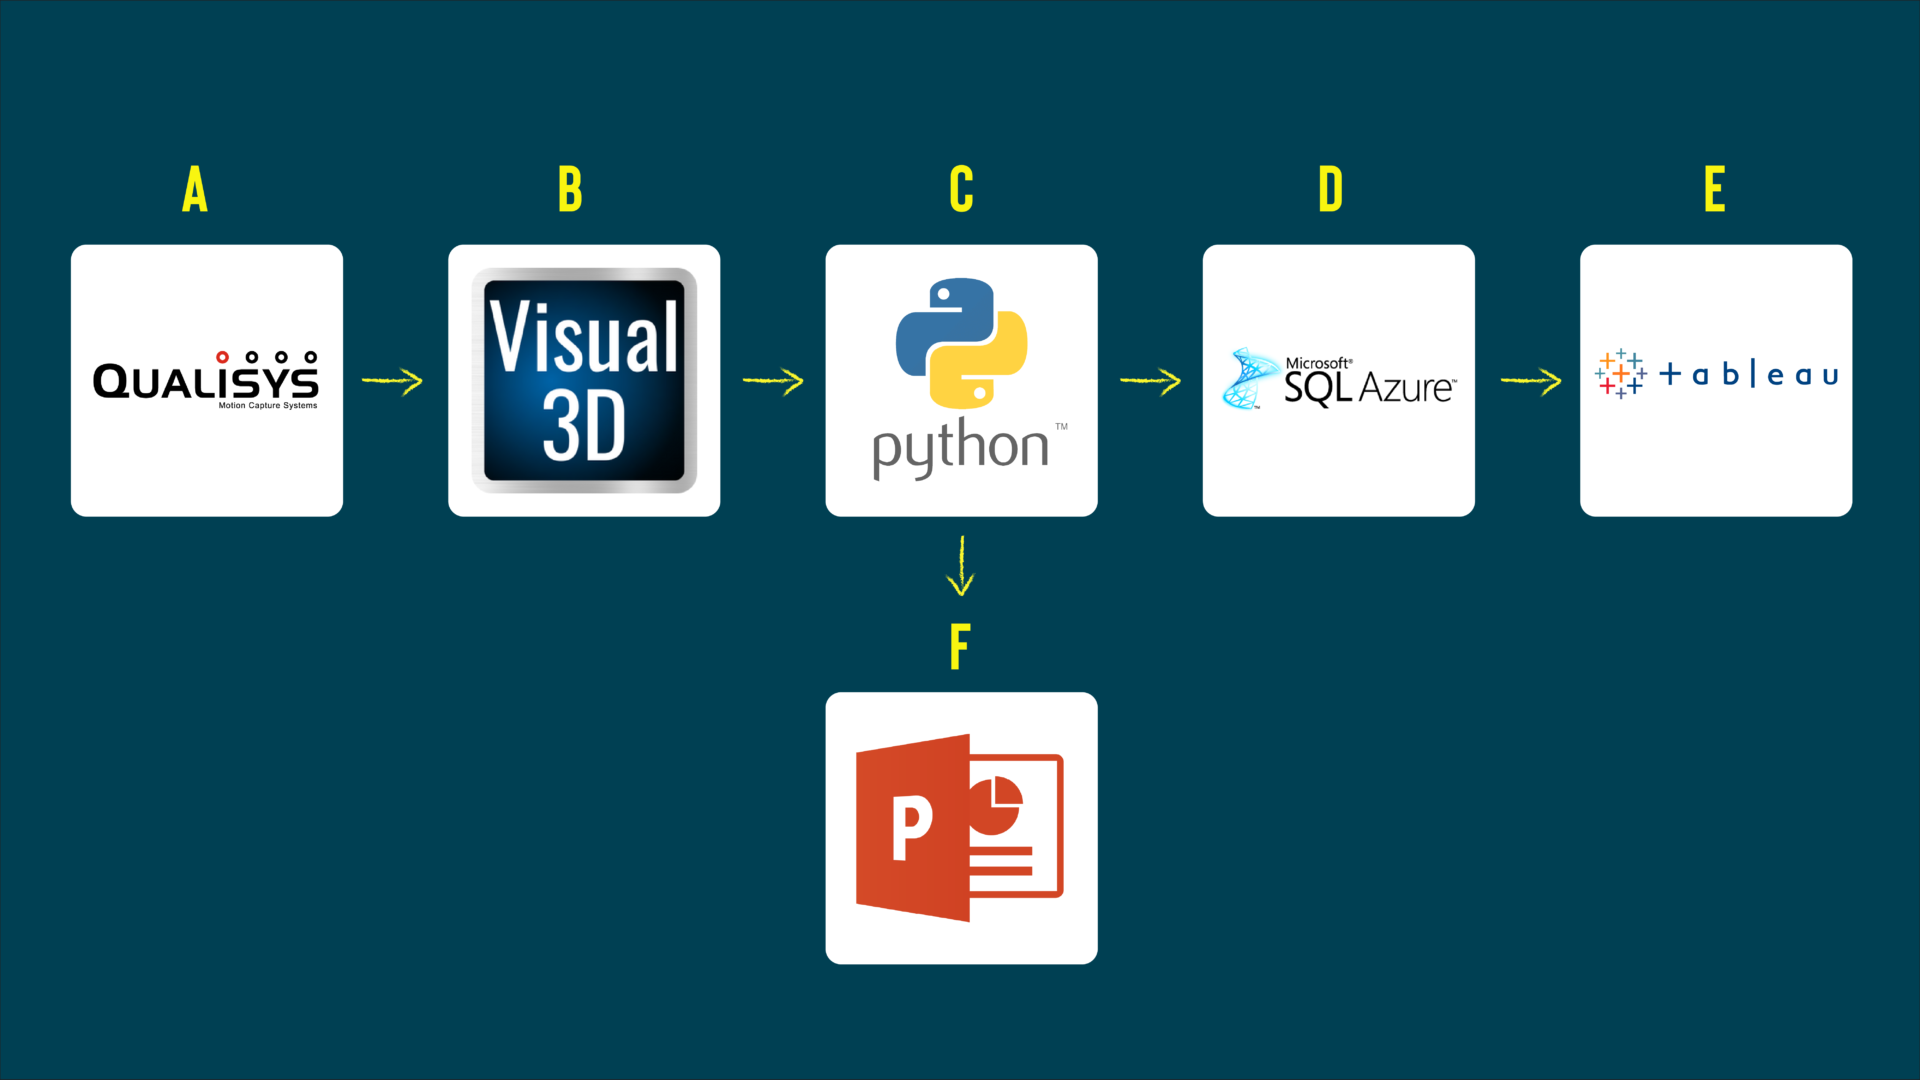
The data moves through a processing pipeline of various software to integrate the raw force and coordinate joint kinetics and kinematics before visualising and databasing (Figure 4). Each step is critical when considering the time between capture and actionable information. We might prioritise specific tasks from a capture to expedite this process and provide actionable information on the same day.
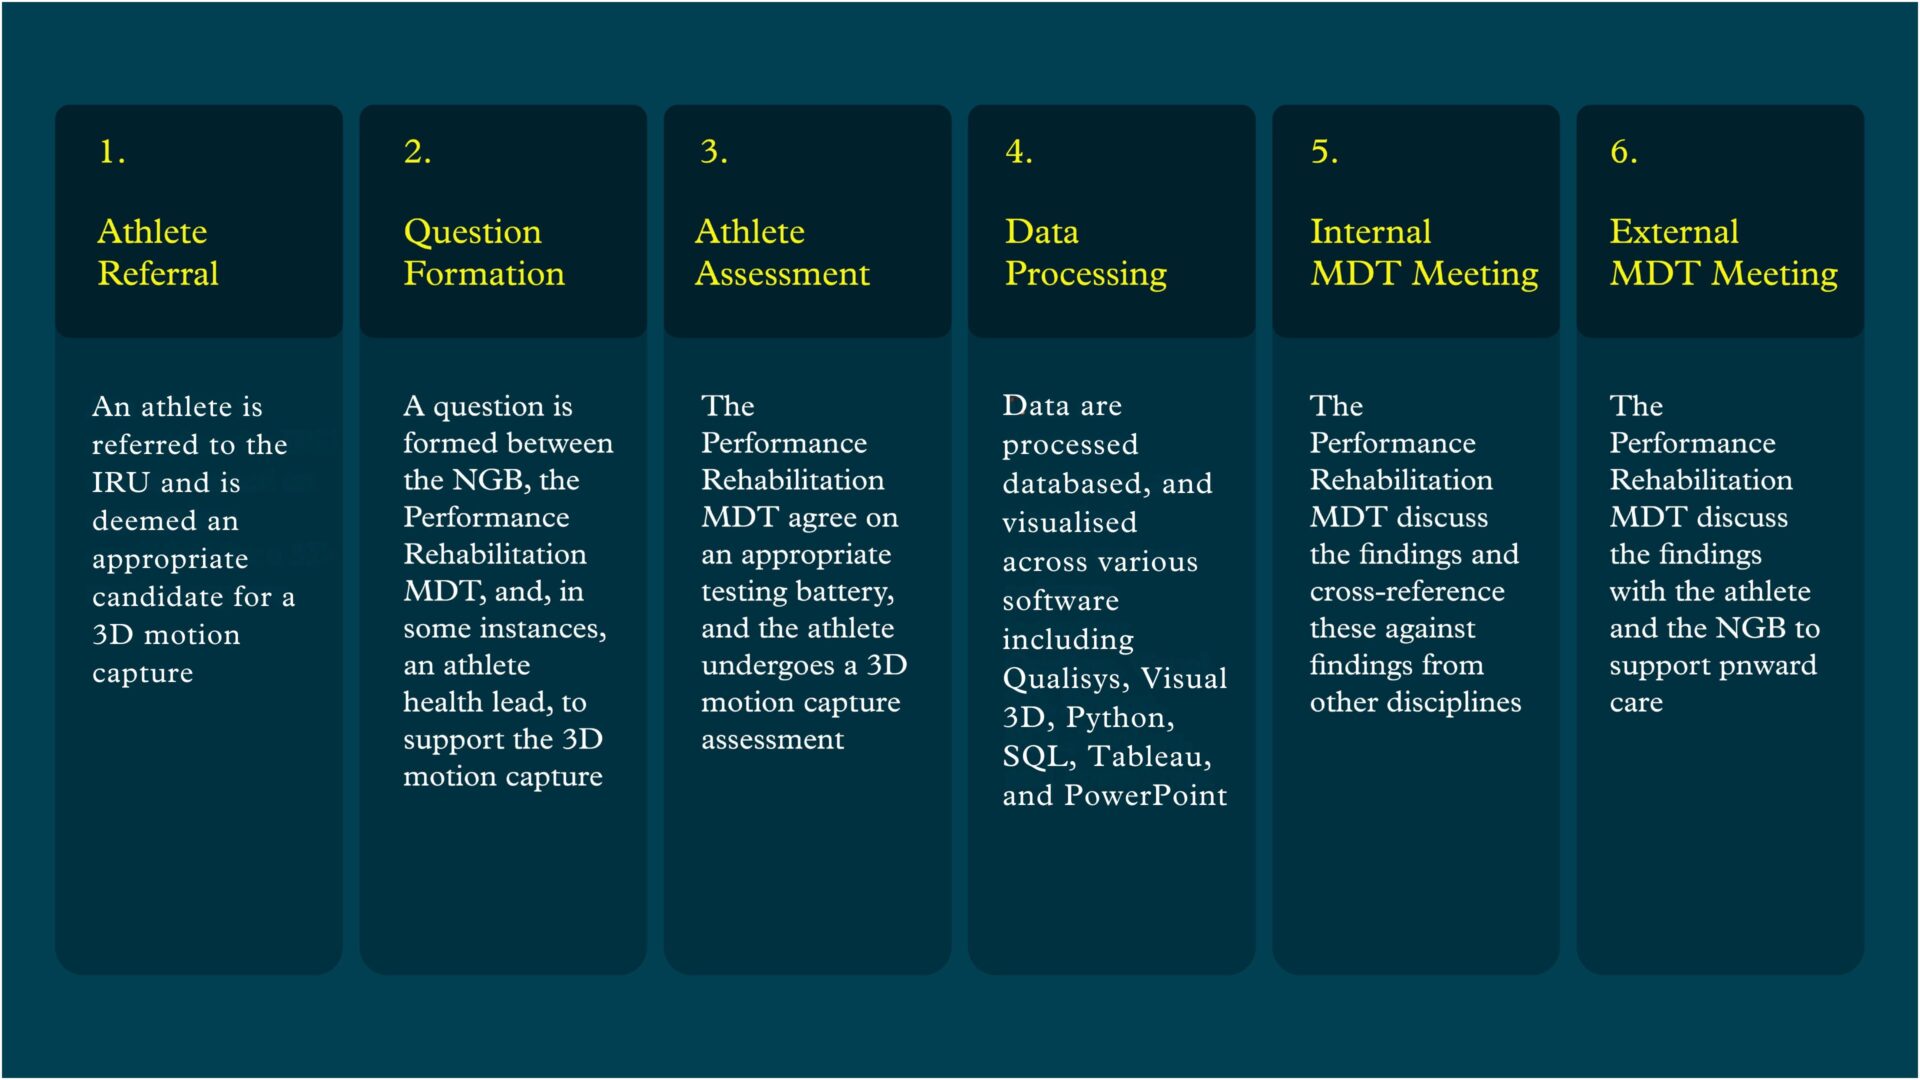
After every assessment, the MDT meets for 30–60 minutes. Although this meeting is focused on the 3D motion capture data, we also consider the physical diagnostics data, clinical observations, and athlete insight to support decision-making.
Setting the contours for the meeting is the original question and a wide selection of visuals: discrete and time series data that describe segmental coordination, interlimb asymmetries, longitudinal changes, and joint biases.
The goal is to identify the key headlines and refine our communications to the fewest and most insightful visuals.
The aim isn’t always to find a problem. Sometimes, the data supports what we’re already seeing: that things are going well, and no substantial changes are required. This reassurance is valuable. It provides evidence that the athlete is achieving the desired outcomes, or that they are not developing negative compensatory movement strategies.
This MDT process is where the real value of 3D motion capture is unlocked. The shared interpretation, anchored in context, allows us to act with confidence.
Case examples: Reinforce, reveal, reassure
Here are three examples of how 3D motion capture has influenced rehabilitation. Sometimes it reinforces what we suspected, sometimes it reveals something unexpected, and sometimes reassures us that everything is on track.
Reinforcing the expected
An athlete in late-stage rehab following an anterior cruciate ligament reconstruction came to the Intensive Rehabilitation Unit. The NGB physio and S&C coach suspected that the rehabilitation was not progressing as quickly as expected, and they had observed some compensatory movement patterns from this athlete.
The athlete’s compensatory movement pattern was a knee valgus pattern during various skills, such as single leg squatting, jumping, and change of direction.
We asked a broad range of questions in search of the underlying cause of the valgus.
Is there anything medical relating to the pathophysiology that we have missed or need to address? What physical qualities at the ankle, knee, and hip might enable or inhibit a compensatory pattern at the knee? What tests would reveal the presence of a compensatory pattern in knee joint kinetics or kinematics?
These questions directed the clinical, physical, and biomechanical assessments of the affected joint and system as a whole.
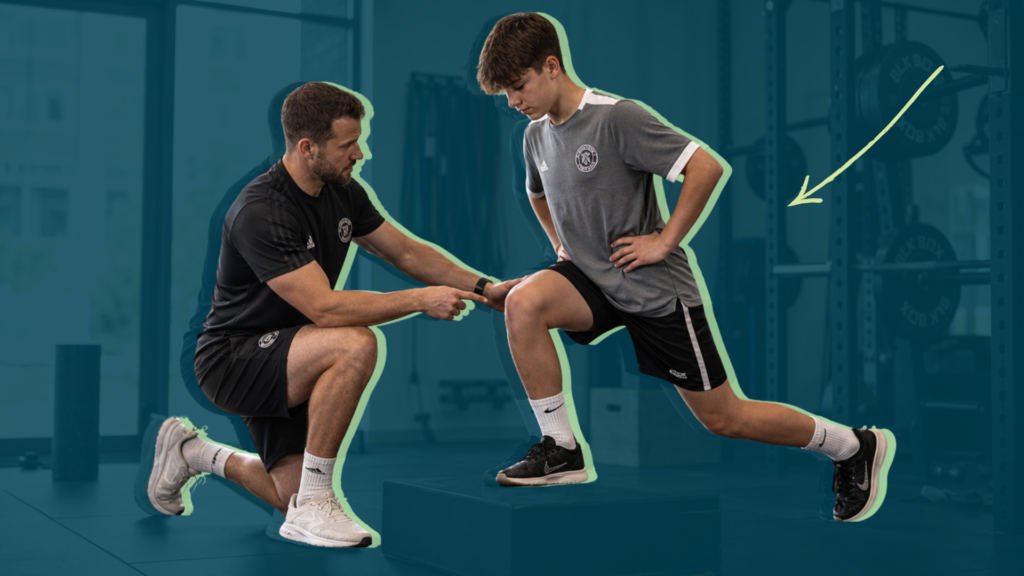
For example, a single leg CMJ and horizontal hop landing would provide detailed information on the knee due to the high kinetic and kinematic demands required to successfully execute the test. Similarly, an assessment of absolute and relative joint contributions during an isometric single leg squat may also provide insight into the function of the knee when contributing to a high force, compound task.
Following a clinical assessment, this athlete underwent a 3D motion capture alongside a series of physical diagnostic tests to gain further insight into their progress, and identify any potential gaps in their movement strategies and physical qualities.
The data from the 3D motion capture showed an increased knee valgus angle on the reconstructed side alongside asymmetrical ankle, knee, and hip mechanics during single leg jumping and landing. This athlete also presented with reduced knee extension torque on the affected side during isokinetic testing; along with an inability to achieve a positive shin angle under load.
Other markers like ankle dorsiflexion range of motion, plantarflexion strength, and hip strength were all symmetrical and in line with our reference data.
We continued with a rehab phase that focused on developing the physical qualities around the knee before progressing field-based training further.
Tweet This3D motion capture showed an increased knee valgus angle on the reconstructed side alongside asymmetrical ankle, knee, and hip mechanics during single leg jumping and landing. This athlete also presented with reduced knee extension torque.
@Adammattiussi
Revealing the unexpected
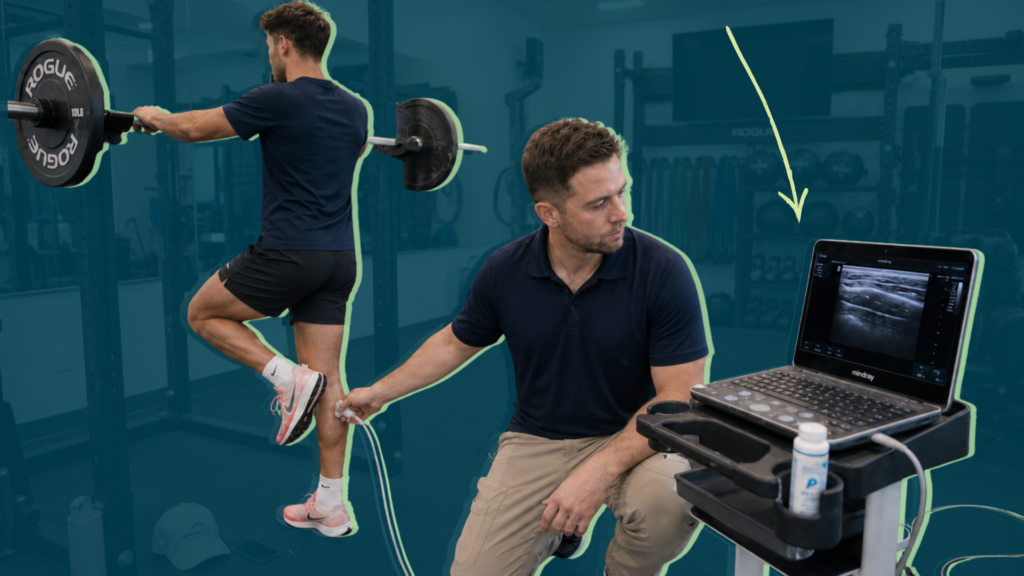
An athlete returning from a significant lateral ankle sprain had progressed well through early milestones. The team were satisfied that the athlete had demonstrated comparable ROM through tests such as knee to wall; equal muscle mass through calf girths and ultrasound muscle depths; and relative strength that was symmetrical and in line with reference data through plantarflexion isometrics, plantarflexion / dorsiflexion isokinetics, and inversion / eversion isokinetics.
However, when reintroducing higher velocity tasks, they reported low confidence during jumping and landing.
Our questions were whether the athlete’s low confidence had psychological roots, or came from a physical deficit.
3D motion capture during double leg and single leg jumping tasks could reveal further insights into ankle joint kinetics and kinematics. Single leg 10-5 pogos may be best placed to expose any ankle deficits, but CMJ and double leg variations were also relevant.
A 3D motion capture revealed reduced ankle joint moments on the affected side across both double and single leg CMJs and pogos.
These deficits weren’t obvious from physical diagnostics nor clinical assessment. They also didn’t surface during typical performance outcomes derived from single axis force plates, such as peak force, jump height, or reactive strength index (including its constituent parts).
The data highlighted an ongoing limitation in ankle-specific load tolerance that hadn’t yet been resolved, despite more holistic improvements.
The insights into ankle function informed the physiotherapy session later that afternoon. That session addressed both confidence and ankle-specific work.
The immediate, subjective improvement in function led to a follow-up capture the same day, which further informed planning and programming across the week. These changes in microcycle structure and detail are subtle but supported engaging conversations with the athlete, internal confidence in delivery, and acute changes in performance.
Tweet ThisThese deficits weren’t obvious from physical diagnostics nor clinical assessment. They also didn’t surface during typical performance outcomes derived from single axis force plates, such as peak force, jump height, or reactive strength index.
@Adammattiussi
Reassurance that everything is OK
An athlete referred to the IRU presented with ongoing minor hip symptoms following a traumatic pelvis injury several years prior. This athlete was competing through these symptoms. We framed the assessment as an opportunity to identify any potential compensations that may support ongoing programming.
The key question was: How can we best understand the hip and trunk in isolation and during compound movements?
The team identified a battery of physical tests around the hip and trunk: isometric and isokinetic assessments of hip abduction / adduction, hip flexion, and trunk flexion / extension. These would inform any hip and trunk-related work for this athlete’s program.
3D motion capture could also provide insights into joint kinetics and kinematics, and movement sequencing during dynamic compound movements. Single leg CMJs and pogos could provide detailed insight into any potential compensation. Isometric force tests, on the other hand, might not have provided the necessary insights for the athlete’s sport-specific demands.
The 3D data showed symmetrical joint kinetics and kinematics, appropriate sequencing and timing of segments, and no evidence of protective strategies such as changes in rate or magnitude of loading.
The key takeaway, then, was that the athlete was not making any significant compensations during jumping and landing tasks.
This clarity was valuable not just for internal planning, but also for communicating to the wider coaching team. The result was a minor review of the hip and trunk programming that this athlete was completing as part of their ongoing rehabilitation program, as opposed to a more significant intervention.

Cautions and caveats
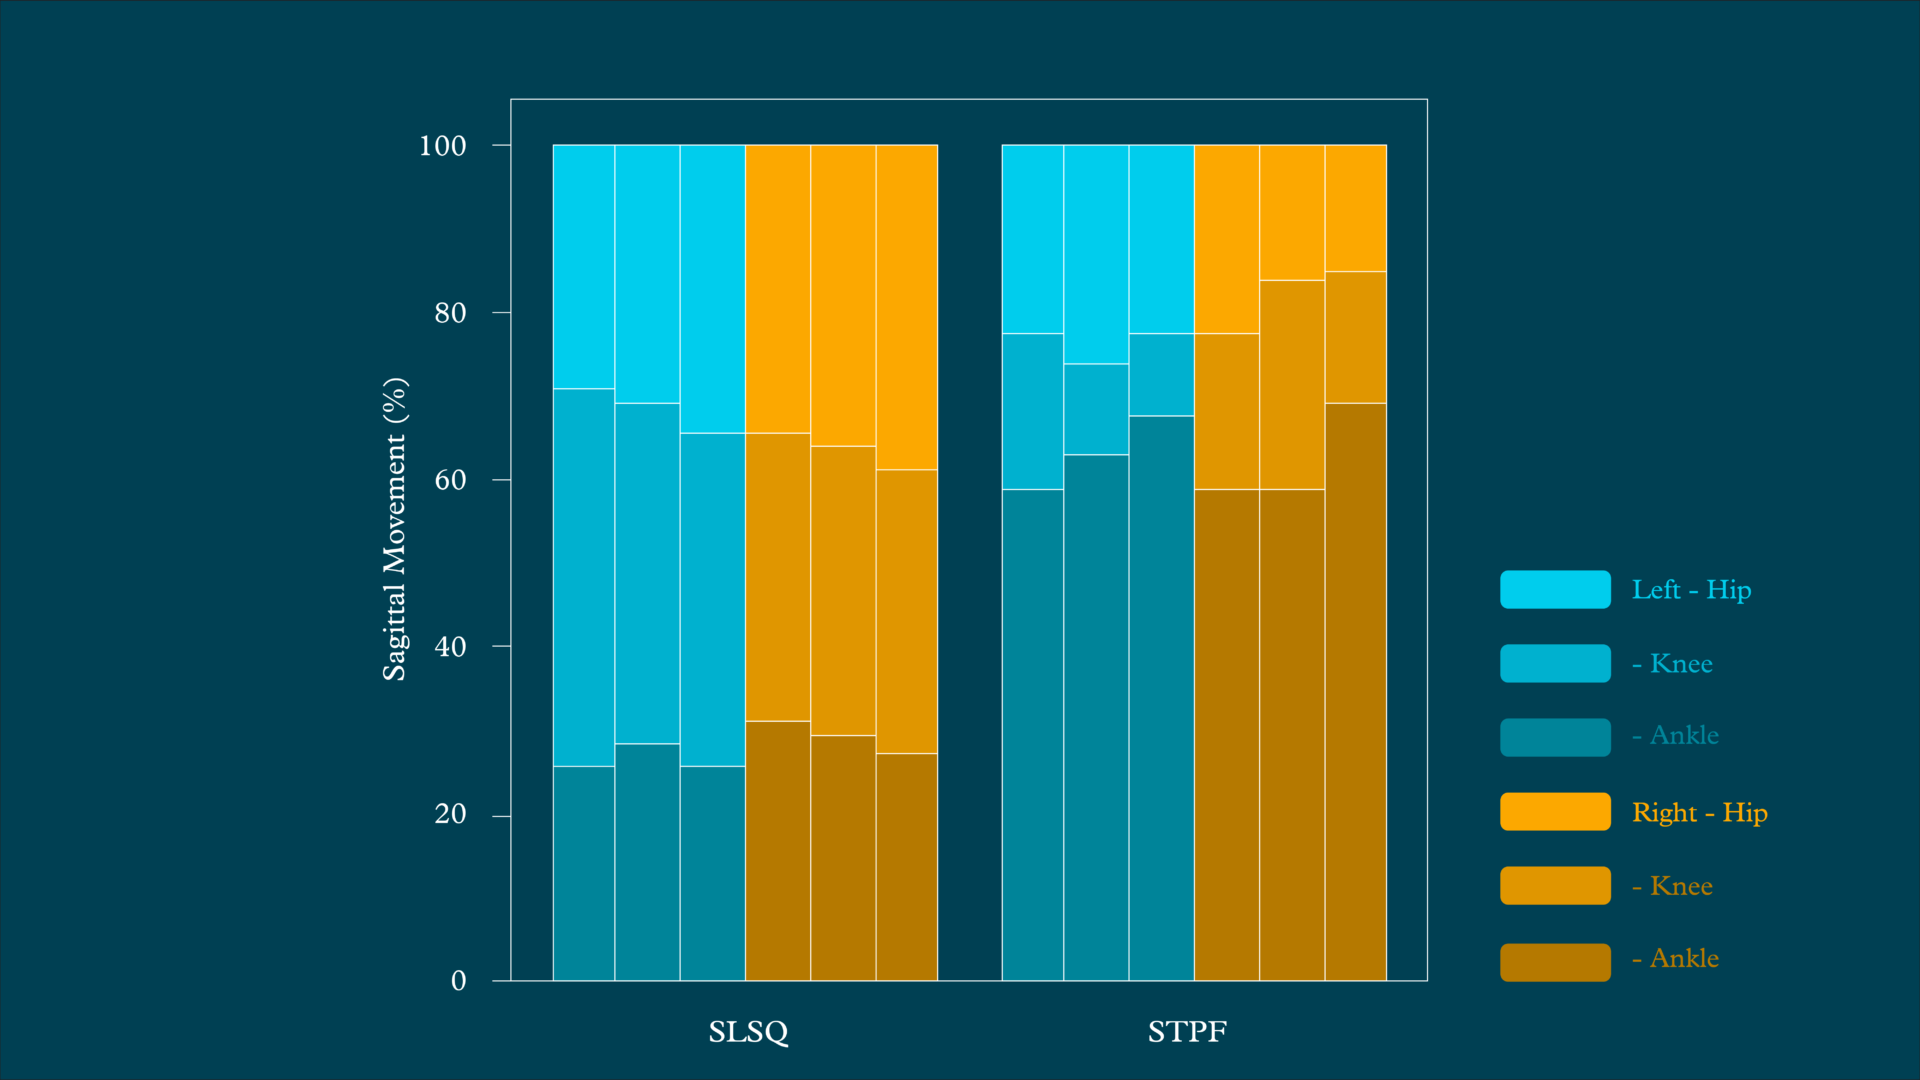
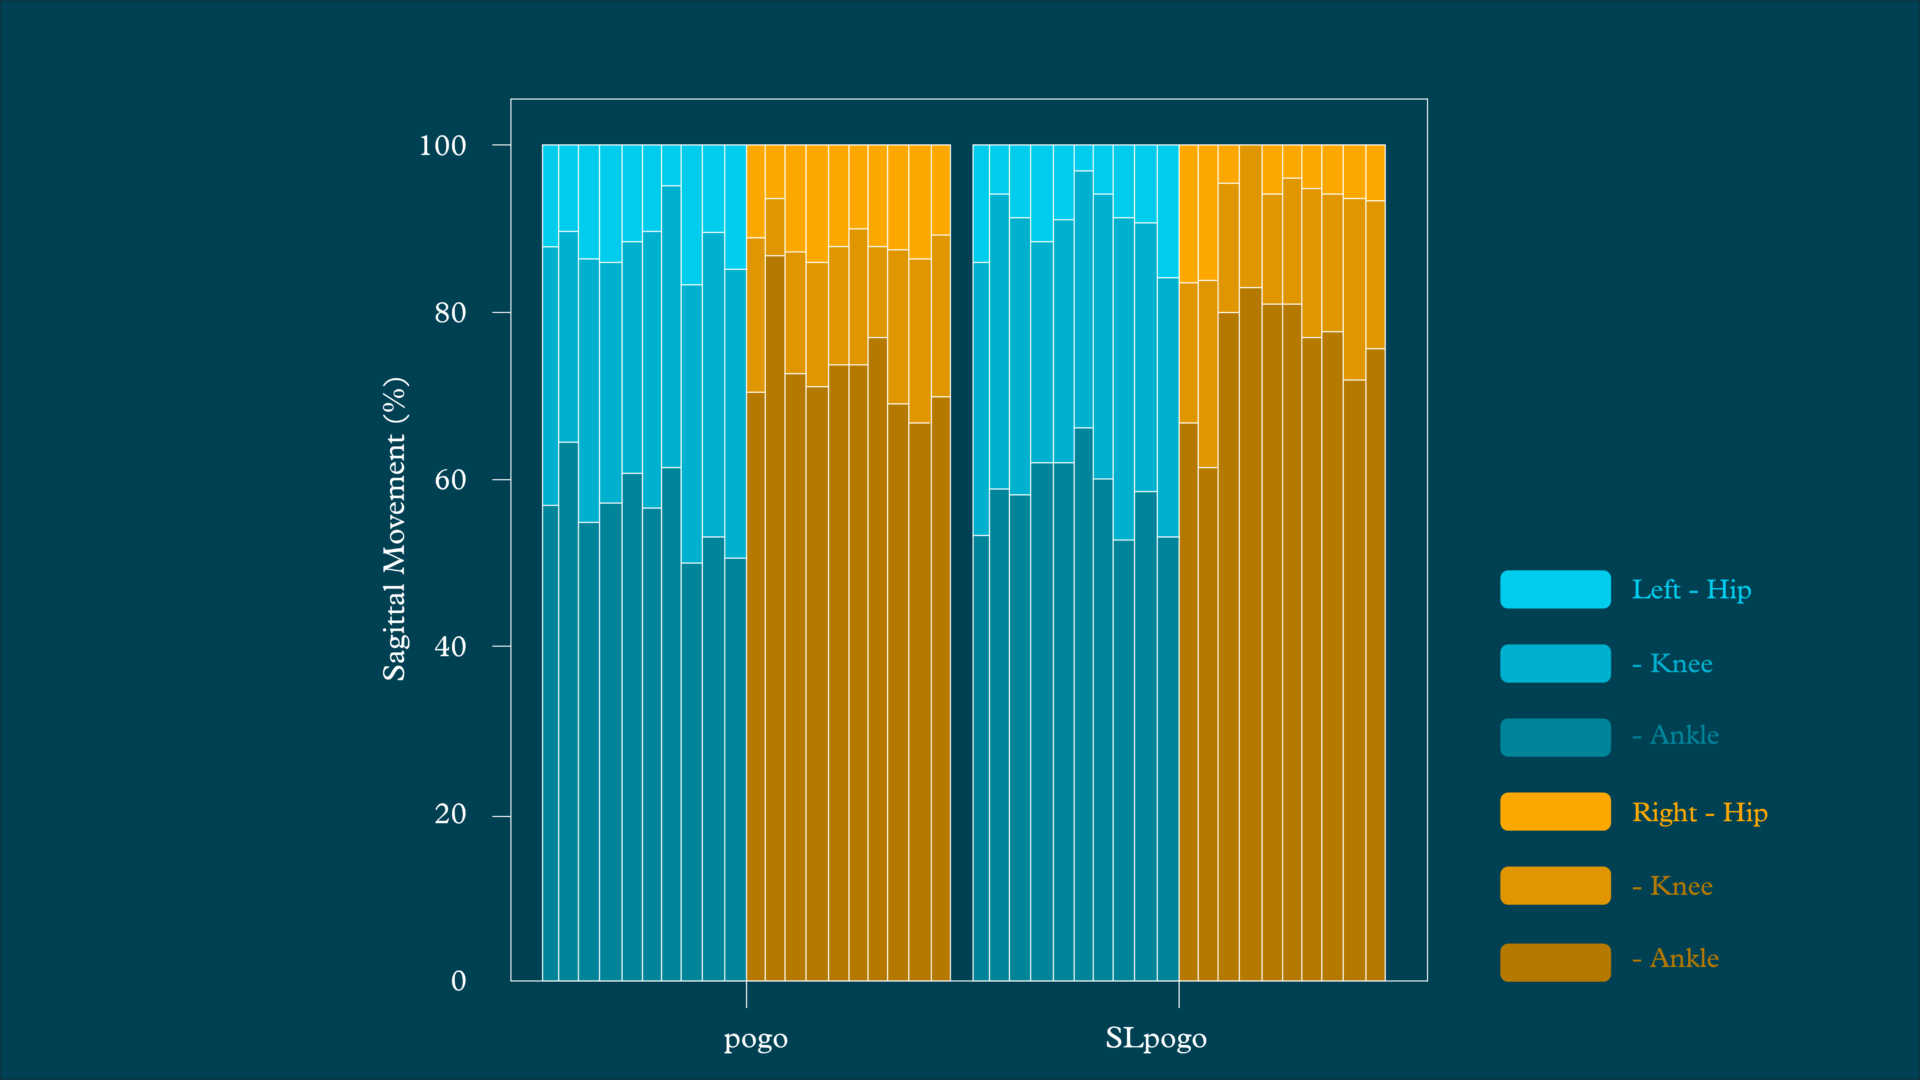
We regularly use discrete metrics such as peak joint angles, moments, or relative contributions (Figures 5-6). They’re easy to interpret and fast to share.
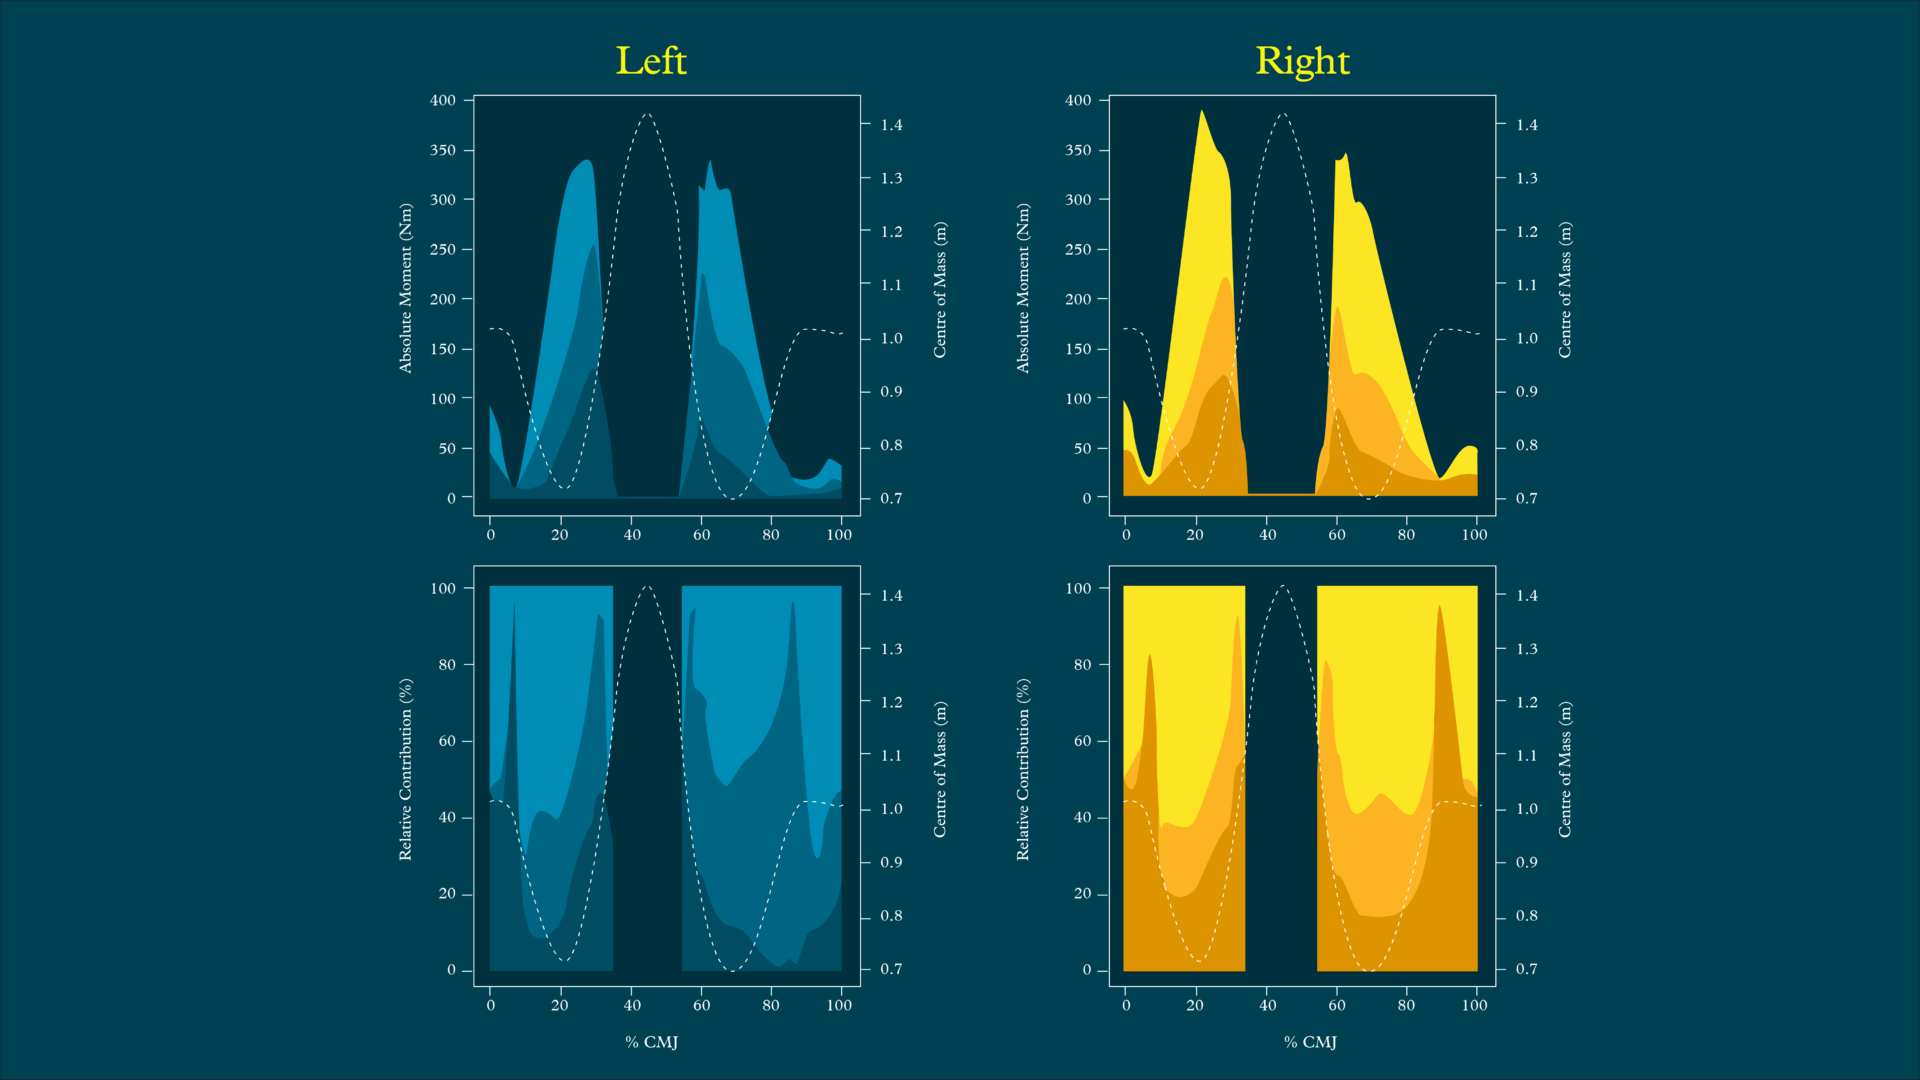
But sometimes these summaries miss the bigger picture and can be reductionist. For example, an athlete’s peak joint moments may be symmetric, but they present with noticeably different joint moments throughout the remainder of the task. Further, the relative contributions of each joint may be normal across both limbs, but the magnitude of the values observed between limbs is significantly different.
We have since begun using the continuous data more frequently, as it can provide a greater understanding of the entire movement strategy (Figure 7).
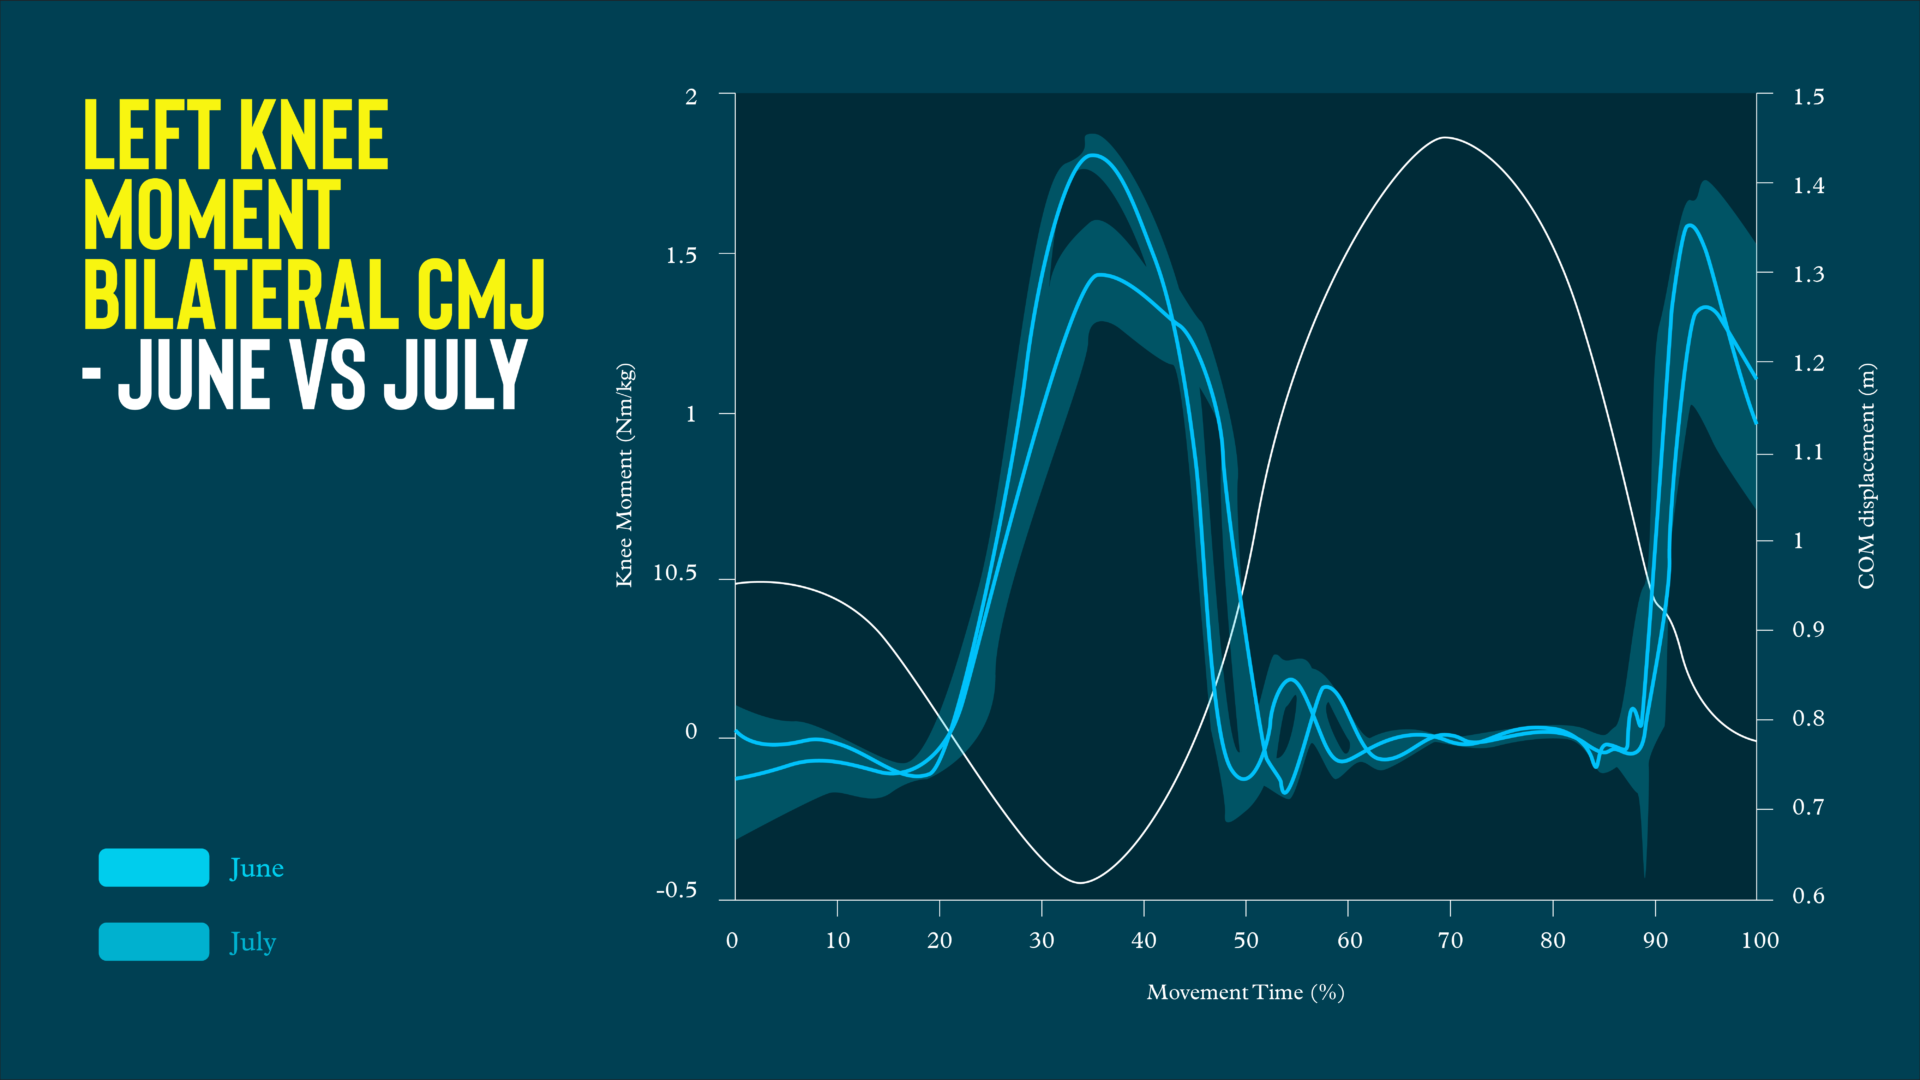
Identifying a meaningful difference in symmetry or change over time in continuous data is challenging. We’ve explored various methods, such as multiple standard deviations, 95% confidence intervals, and statistical parametric mapping to compare continuous data across limbs or time points (Figure 8).
This helps us to identify where in the time series meaningful differences occur, avoid false confidence from non-significant or discrete differences, and better match rehab interventions to subtle movement deficits. We don’t use this in every case. But it helps us improve how we interpret and monitor progress in more complex or ambiguous cases.
Tweet ThisContinuous data helps us to identify where in the time series meaningful differences occur, avoid false confidence from non-significant or discrete differences, and better match rehab interventions to subtle movement deficits.
@AdamMattiussi
Communicating the message: Less is more
The final part of the process is sharing the information with the athlete and the practitioners providing daily support within their sport. The MDT approach extends into that meeting, so we can most effectively communicate what we have observed with clear suggestions on next steps.
This is also an opportunity for us to ask the athlete or practitioners for their interpretation of our work. We want to hear what the findings mean for them, how the movement patterns we’ve identified might influence training or competition, and how they might address these issues moving forward.
We aim to keep feedback focused and relevant, using 3D motion capture to enhance—not overcomplicate—our message.
So far, our system is focused on jumping and landing tasks. But we’re actively exploring sprint mechanics, change of direction, and upper limb assessments. These bring new challenges—technical, interpretive, and logistical—and reflect the next phase of growth as we bring biomechanics even closer to sport-specific rehab.
Tweet ThisAfter every assessment, the MDT meets for 30–60 minutes. Although this meeting is focused on the 3D motion capture data, we also consider the physical diagnostics data, clinical observations, and athlete insight to support decision-making.
@Adammattiussi