

My previous articles referred to the idea that coaches and athletes can develop similar sprint acceleration performances through different movement strategies. Shortly after those, Stuart McMillan wrote an excellent two-part series about how practitioners can gather useful information to better understand the athletes they are working with by appreciating the different strategies athletes adopt during sprinting. This type of understanding can help us avoid some potential pitfalls associated with generalising group information to individuals (e.g., [1]). For instance, findings from whole-group averaged data do not always apply to athletes at the individual level.
Practitioners usually discuss sprinting strategies in performance terms: strategy X is more effective than strategy Y, as demonstrated by these athletes’ results, and so on.
However, we don’t often talk about sprinting strategies in the context of how they may relate to different types of injury or injury sites. This article will attempt to discuss some of these issues and, hopefully, this information will give food for thought to those working in the realms of injury and rehabilitation.

Characterising initial acceleration strategies
You could measure many variables when assessing an individual’s movement features during acceleration. Alan Murdoch provides an overview in his recent article on creating a “blueprint“ for developing your coaching eye. One of the ways I try to better understand the athletes I work with is by classifying their individual acceleration strategies using a whole-body kinematics approach [2]. This broadly involves combining an athlete’s spatiotemporal variables in their dimensionless form (controlling for stature) using two ratios: 1) step length:step rate, 2) contact time:flight time.
Figure 1 shows the ratios for each individual as z-scores in the context of a wider athlete group.
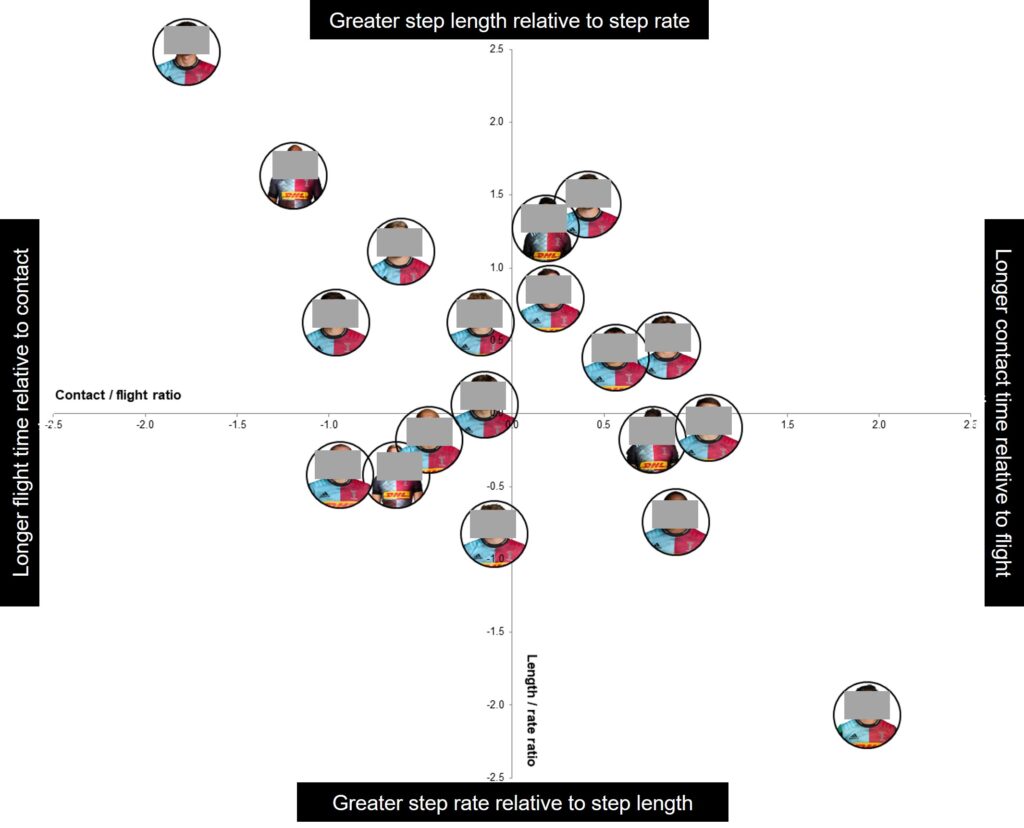
Ratio values alone can mask important information, so we must still consider the values of those individual variables. For example, an individual can achieve a high step length:step rate ratio (athletes higher up on the vertical axis in Figure 1) and have either a long or short step length relative to their group’s norms. However, the ratio still provides information on these athletes’ relative preferences of step length and step rate.
My preferred approach for characterising acceleration strategies is to use a combination of normalised spatiotemporal variables, for three principal reasons:
1) They can be obtained promptly, which is important in an applied setting for data to be actionable.
2) They represent the movement outcomes of sprinting and can be used to alter technical features from an external perspective.
3) They can be obtained reliably for individuals across multiple sprint trials [2], so we can detect meaningful changes with confidence. Without knowing the variability of what we are measuring, the data we collect can be meaningless since it will likely lead to a poor interpretation of the data.
Figure 1 displays a group of rugby union backs according to their whole-body kinematic strategies. Players towards the top of the diagram have a high step length relative to their step rate, while the opposite is true for the players more towards the bottom. Looking horizontally, players towards the right have a long contact time relative to their flight time, and the reverse as we look towards the left. Note that all athletes still produce contact times that are longer than their flight times since the graph displays acceleration over the initial six steps of a sprint. However, their position along the x-axis provides an indication of their preferences towards the amount of time they spend on the ground or in the air relative to the group.
A link between whole-body acceleration strategy and injury site?
Different whole-body acceleration strategies can inform us about how muscle, tendon or joint stresses vary across these strategies. This may be useful in understanding the context of injury. The information below is based on some of my observations working with team sport athletes
It should go without saying that I am not suggesting that if an athlete sprints a certain way as revealed by the location of their whole-body kinematic strategy on an x-y representation like Figure 1 that they will end up with a muscle-tendon injury at a specific injury site associated with that given acceleration strategy.
Humans are complex adaptive systems with multiple interacting components [3]. We can not predict with high accuracy any injury based on an individual’s sprinting strategy alone. However, it is important to pull together multiple sources of information (e.g., injury history, training programme, training load, lifestyle factors) to help make best guesses about what causes their injuries. Aggregating this information may be of particular use when looking at injuries which may be deemed “avoidable,” that is, injuries which occur acutely during sprinting; or injuries that have progressed over time beyond physical complaints or “niggles” that have no clear causative factors such as high energy contact-based trauma.
Identifying whole-body kinematic acceleration strategies (or other sprint-based movement features) may provide another piece of information about the roots of an injury or physical complaint. This may prove useful in rehabilitating athletes or in planning and executing multi-faceted interventions to reduce the possibility of new physical complaints from arising. Figure 2 highlights the muscle-tendon injury sites which appear to be linked to athletes’ acceleration strategies. I do not have enough rigorous data to show with certainty that a given acceleration strategy will increase the chances of an athlete experiencing a specific type of injury at a particular site, nor do I think this will ever be possible with a high degree of confidence. However, the following information represents some general trends based on preliminary data and observations from the team sport athletes I have worked with, specifically over the past five years of using the whole-body kinematics approach to measure acceleration strategies.

Quadrant 1
During initial acceleration, vertical impulse largely determines the step length:step rate ratio [4], mainly due to the strong association of vertical impulse with step length. This is characteristic of the individuals you see higher up in Figure 2.
In terms of muscle involvement during these steps, the soleus and gastrocnemius contribute the most to the vertical impulses [5]. Therefore, these muscles may be somewhat of concern for the athletes towards the top of the graph, but specifically more so for the athletes in the top left quadrant. Their contact time:flight time ratios are low. They likely require large amounts of elastic storage and return during relatively shorter contact phases to achieve their relatively longer flight time. This may lead to high levels of elastic strain placed on the Achilles tendon for these athletes and require large plantarflexor muscle involvement.
The occurrence of Achilles, calf and foot issues seems to be more prevalent within this quadrant.
Quadrant 2
Although athletes in the top right quadrant also produce large step lengths relative to their step rates, they have longer contact time:flight time ratios and do not appear to rely as much on the storage and return of elastic energy at the Achilles, or plantarflexor involvement, to the extent of the athletes in quadrant 1.
Although not to the same magnitude as the plantarflexors, the vasti group contribute meaningfully to vertical impulse. They also contribute a large amount to braking impulses, acting as decelerators during the early stance phase [5]. This appears to be a feature of athletes in quadrant 2, who tend to touch down further forward relative to their centre of mass and require the knee to “apply the brakes” and provide the vertical support forces necessary to remain upright. These athletes appear more prone to patella tendon and quadriceps-based issues.
These athletes also tend to favour using their posterior hip and thigh muscles to contribute to forward propulsion during ground contact, “pulling” their body through the stance phase. This is simply an assumption of their internal mechanics based on visual observation of the movement features.
Coupled with smaller flight times relative to their contact times, they often exhibit greater knee extension angular velocity (i.e., they “cast their foot forwards”) during the late swing phase. Just prior to touch down, a flexor moment acts at the knee joint as it extends during a period of power absorption. This may potentially elevate the risk of hamstring strain, although typically more so during later stages of acceleration and maximum velocity.
Quadrant 3
Athletes in the bottom right quadrant appear more prone to hip-based issues. This is likely because, with higher step rates, the muscles spanning the hip generate higher forces to swing the legs backwards and forwards more vigorously during the swing phase [6].
A steep increase in force produced by the hip flexor muscles also occurs towards the end of the contact phase. While the hip is extending in late stance, there is a flexor moment and power absorption at the hip. The anterior hip muscles attempt to decelerate the thigh in preparation for the swing phase, resulting in a steep increase in force produced by the iliopsoas [5].
Collectively, the athletes in the bottom right quadrant accordingly seem to pick up more hip-based complaints, particularly the hip flexors and adductors. Like athletes in quadrant 2, athletes in quadrant 3 can often produce large knee extension angular velocities in the late swing phase where flight times are short; and the point of touch down is often further forward relative to their centre of mass than for athletes in quadrants 1 and 4.
Quadrant 4
For similar reasons as those outlined for athletes in quadrant 3, athletes in quadrant 4 can frequently present with hip-based issues – usually anterior hip and adductor muscle-tendon complaints.
Like athletes in quadrant 1, their contact time:flight time ratios are low. They like to spend time in the air, and the elastic strain on the Achilles tendon can be quite large. They. too, are prone to calf / Achilles and foot issues, although not usually to the extent as those seemingly experienced by athletes in quadrant 1.
These athletes can be a real challenge to work with and are often carrying a number of physical complaints. These complaints are often not severe enough to pull them out of training or matches altogether, but do require frequent modifications to their training.
Initial exploratory data
Figure 3 shows some preliminary data from female lacrosse players of the relative proportion of time they missed from training and competition (days) due to lower limb injuries according to injury site location. The athletes are clustered based on their whole-body acceleration strategies (quadrants). These data are from a nine-month period (Jul 2021-March 2022). Each pie chart shows the total number of training or competition days players in each quadrant missed, and the percentage breakdown according to injury site. Injuries include only those that occurred during running and sprinting, or physical complaints with unknown aetiologies resulting in time-off training or competition (e.g., an Achilles tendinopathy which emerged without a distinct knowable cause). High energy contact-based injuries have not been included within the data.
Tweet ThisBased on my observations and some preliminary data, I have seen some notable patterns in relation to acceleration strategy type and injury site within team sport athletes
@wildy_jj
We visually inspected the data to check that they were not skewed by selected individuals in each quadrant. Although this is a preliminary and small data set, we can see in Figure 3 alignment with the suggested potential link between injury site and acceleration strategies outlined above.

Making better estimates, not definitive conclusions
To reiterate a point I made earlier in this article, I do not believe it is possible to predict injury type or sites according to an athlete’s whole-body acceleration strategy, and we will probably never be able to do this with a high degree of confidence.
However, based on my observations and some preliminary data, I have seen some notable patterns in relation to acceleration strategy type and injury site within team sport athletes. Therefore, assessing individual acceleration strategies can provide an extra piece of information to help practitioners build a more comprehensive understanding of the athletes they work with. This could help them make better informed “guesses” of the broad causes of sprint-based injuries. In turn, this may aid the return to play process or contribute to multi-faceted interventions attempting to reduce injury risk.
In my next article, I will take a deep dive into a selection of single athlete case studies and interventions I used to change whole-body acceleration strategies for both acceleration performance and injury rehabilitation.