Strength & conditioning coaches and sport scientists frequently report data as ratios, whether in their published research or applied practice.
For example, when we use jump tests such as countermovement jumps (CMJ) or drop jumps (DJ) to assess an athlete’s neuromuscular performance, common metrics include reactive strength index (RSI), RSI Modified (RSI_Mod) and impulse. Similarly, strength is of paramount importance for virtually every athlete [1,2], yet we often express strength data as ratios, such as rate of force development (RFD) during an isometric mid-thigh pull (IMTP), hamstring to quadriceps ratio (H:Q) during isokinetic dynamometry testing and even the dynamic strength index (DSI) when coupled with jump testing.
Over recent years, there has been a noticeable rise in studies reporting inter-limb asymmetry and bilateral deficit data, based on separate left side and right side data plus bilateral data.
Table 1 provides examples of athlete test ratio data often used in practice and research, with their associated methods of calculation. This information illustrates that, although ratio data presents itself as a single value, it is calculated from two or more components.
Despite their common use, ratio data can often provide challenges, some of which are not always entirely obvious to practitioners. The aim of this article is to discuss some of the pitfalls of ratio data and provide some context on how they can be used in practice if coaches feel they add value to the athlete testing or monitoring processes. This article hopefully will appeal to all practitioners (i.e., those with large and small budgets), as some of the suggested metrics can be computed with a simple app [3].
| Ratio metric | Method of calculation |
| Countermovement jump | |
| RSI Mod | Jump height / time to take off |
| Net propulsive impluse | Net peak force x phase duration |
| Drop jump | |
| RSI | Jump height (or flight time) / ground contact time |
| Isometric mid-thigh pull | |
| Rate of force development | Change in force / change in time |
| Dynamics strength index | Peak force (CMJ) / peak force (IMTP) |
| Isokinetic dynomometry | |
| H:Q ratio | Peak torque (H) / peak torque (Q) |
| Asymmetry | |
| For any test | (Dominant – non-dominant) / dominant x 100 |
| Bilateral deficit | |
| For any comparable bilateral and unilateral tests | 1 – (bilateral / [left + right]) x 100 |
Table 1. Examples of ratio data and their method of calculation
Pitfalls of ratio data and the solution to using it in practice
Why is it an issue to speak of ratios as a single value when they are actually made of several data points? As previous articles have highlighted, any athlete test will have some level of error [4,5]. Some of the potential sources of error are the equipment we use, our testing methods or instructions, the athletes themselves, the warm-up protocols we apply or even the environment where the testing takes place. Our job, as support staff, is to minimise that error so we can have as much confidence as possible in the data we collect.
Tweet ThisWhen we generate ratio data like RSI, we are taking multiple sources of error and then compounding them to create that single value we are left with
@DrChrisBishop
When we generate ratio data, we are taking multiple sources of error and then compounding them to create that single value we are left with. This can negatively impact the reliability, and therefore the usability, of the data we collect. We illustrated this nicely by showing that the reliability of the unilateral DSI was notably worse than the individual parts that make it up [6]. Table 2 summarizes those results.
| Test/metric | ICC | CV (%) |
| ISOS | ||
| Left | 0.93 | 5.2 |
| Right | 0.86 | 5.6 |
| CMJ | ||
| Left | 0.85 | 5.4 |
| Right | 0.83 | 5.2 |
| DSI | ||
| Left | 0.76 | 10.5 |
| Right | 0.71 | 11.9 |
Table 2. Between-session reliability data for peak force during the unilateral isometric squat (ISOS) and unilateral CMJ tests, and the subsequent calculation of the unilateral DSI (adapted from Bishop et al. [6]).
Table 2 shows intraclass correlation coefficients (ICC) and coefficient of variation (CV) data, both of which are measures of reliability. The ICC measures relative reliability. ICC essentially looks at the rank-order consistency of the data, in this instance, between test sessions. The CV is a measure of absolute reliability and looks at the variance of the data between athlete test sessions. CV takes the standard deviation relative to the mean and then multiplies it by 100 to express the value as a percentage.
The scale of an ICC typically goes from 0 to 1, with values closer to 1 representing stronger reliability. In contrast, with the CV expressed as a percentage, the lower value is desirable and shows better absolute reliability.
As the data in Table 2 shows, both the ICC and CV are considerably worse for the ratio – the dynamic strength index – than for the two elements that go into it. Ratio data are likely to illustrate more “noise.” Therefore, this kind of data can be challenging as a guide to decision-making.
Reactive strength index and inter-limb asymmetry: risks of relying on ratios
We may use the associated noise or variance of the test to determine target athlete test scores. For example, using the CV data in Table 2, if an athlete generates 600 Newtons (N) of force on their left leg during a single leg CMJ, we could multiply 600 by .054 (recall that it’s a percentage) to get 32.4 N. Thus, any change greater than 32.4 either side of 600 N would represent a true change in peak force [5]. However, if we now apply this same calculation to the left leg DSI score, the target score is now set by a CV value that has nearly doubled (10.5%). Finding true change is now harder to establish because of the associated noise.
Also note that this example represents only two test sessions, and separate issues with ratio data can also be illustrated when tracking change over time.
Table 3 provides example changes in reactive strength index during the drop jump test, but with the component parts of jump height and ground contact time (GCT) also provided.
| Metric | Week 1 | Week 2 | Week 3 | Week 4 |
| RSI | 2.00 | 2.21 | 2.17 | 2.41 |
| Jump Height | 0.50 | 0.53 | 0.50 | 0.53 |
| GCT | 0.25 | 0.25 | 0.23 | 0.22 |
Table 3. Hypothetical RSI scores reported weekly throughout a 4-week block of training, which focuses on concurrent strength and power development.
In our hypothetical DJ scenario (Table 3), the RSI scores are improving weekly. However, the means by which this value improves is not consistent throughout the training block. For example, in week 2, jump height is the metric driving increases in RSI, but in week 3, the improvements in RSI are now attributable to shorter GCT. Finally, in week 4, we now have a concurrent improvement in both component parts, which has resulted in a bigger improvement in RSI.
If practitioners are only monitoring the ratio metric – in this instance, RSI – we will not be maximising our understanding of why these changes occurred.
Tweet ThisIf practitioners are only monitoring the ratio metric, we will not be maximising our understanding of why changes occur
@DrChrisBishop
If we don’t fully understand why these changes occurred, we cannot expect to fully understand the efficacy of our training interventions. That, in turn, makes it harder to review and adapt our training interventions on an individual basis, noting that, in this case, it is likely that athletes will exhibit a range of different strategies to improve their RSI score (or any other metric being monitored).
The key take-away is to always interpret the ratio in conjunction with the component parts, so that any proposed alterations to training programmes can reflect the individual requirements for each athlete’s movement strategy.
To provide one more example, we will look at the use of inter-limb asymmetry data, which has been a popular topic of investigation in recent years [7,12,9,10,11].
Inter-limb asymmetry refers to the difference in performance or function of one limb relative to the other (e.g., left vs. right, dominant vs. non-dominant, involved vs. uninvolved).
Figure 1 shows peak force asymmetry from a unilateral CMJ test in 10 hypothetical athletes over two athlete test sessions. The data is presented in absolute values, i.e., with all percentage scores as a positive number. With the data presented this way, it looks like some of the group have reduced their between-limb imbalance between athlete test sessions. Many practitioners may intuitively think is a good thing. However, Figure 2 shows this data within the context of limb dominance, where the magnitude of asymmetry (the percentage) is unchanged: any bar above the x-axis favours the dominant limb and any bar below the x-axis favours the non-dominant limb.
Athletes 1, 4 and 6 have reduced the magnitude of asymmetry, as seen in Figure 1, but they have had a shift in limb dominance, as well.
To use Athlete 1 as an example, the 2.2% reduction in asymmetry is arguably less important than the 8.8% shift in limb dominance. If this shift in limb dominance occurs as the athlete is returning from injury – which is highly possible [12] – it may have potential knock-on effects increasing the risk of re-injury [13]. However, it should be noted that these fluctuations in limb dominance also appear to be common in healthy athletes when monitored over time [12,6].
These shifts likely are more relevant for practitioners to monitor during an athlete’s rehabilitation journey [12]. However, monitoring these fluctuations are still recommended for healthy athletes, so practitioners have baseline data to refer back to, if and when athletes get injured. However, unless the component parts of asymmetry are being concurrently monitored (in this case, the raw peak force values for dominant and non-dominant limbs), this shift in limb dominance may remain unnoticed.

Figure 1. Individual peak force asymmetry data from the unilateral CMJ test.
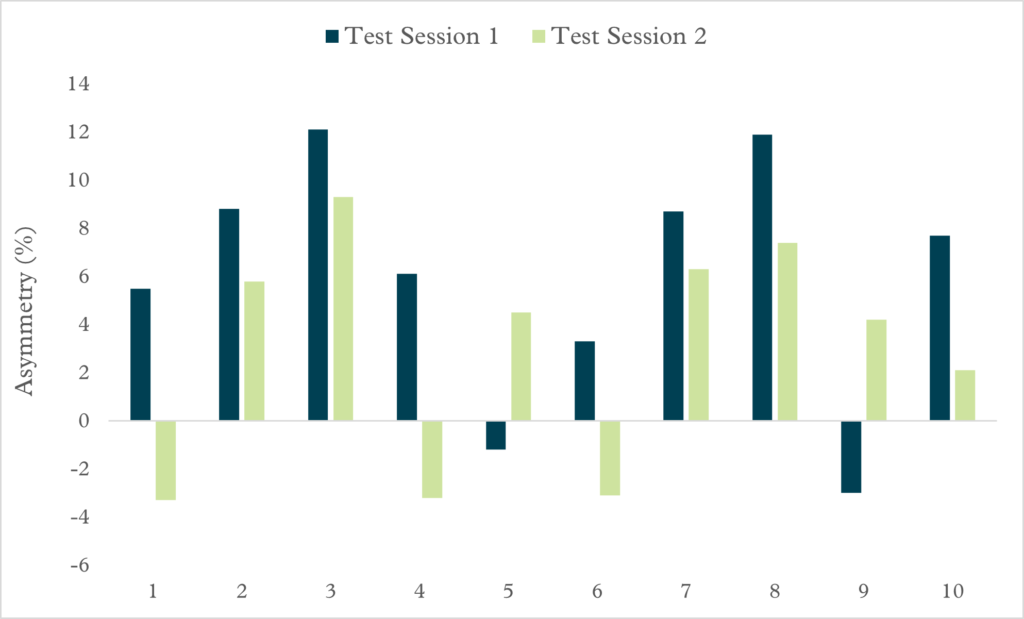
Figure 2. Individual peak force asymmetry data from the unilateral CMJ test. Note: bars above 0 indicate asymmetry favours dominant limb and below 0 indicates asymmetry favours non-dominant limb.
Key takeaways on using ratios in sports performance
These examples highlight some of the limitations that practitioners may face when using athlete test ratio data. Given the additional noise that often accompanies ratios because of their multiple inputs, practitioners are advised to also monitor each component part. This will help contextualise the data we collect as part of the routine and ongoing monitoring process, providing a better chance of being able to use this data as part of the decision-making process.
Practitioners should also first determine that each component of any given ratio has acceptable reliability, as even one noisy metric will contribute to heightened noise when combined with another to create the ratio.