

The increased availability and use of GPS wearables are driving an increase in the number of metrics available to track and monitor. Metrics range from easy to understand, like total number of decelerations, through the more complicated metrics, like average metabolic power.
A metric being hard to understand tells us nothing about its potential value. We must weigh the appropriateness of each metric, whether it is novel or established, simple or complicated. Appropriateness will vary depending on the practitioner and the sport. For example, I may be more interested in the number of peak accelerations a cricket batsman performs than I would be for an Australian Rules Football midfielder. At the same time, I may be more interested in that midfielder’s high speed running volumes than the batter’s.
This applies within the sport, too. A coach working in American football is almost certainly looking at different metrics for their wide receivers than they are for their defensive linemen.
The usefulness of a metric is a key element of its appropriateness. When weighing load management metrics, traditional locomotive metrics such as sprint distance may be more useful than some custom metrics on offer from GPS providers. This will depend on personal bias, the most current research, and how a given metric can impact the training programme as a whole.
With all that in mind, why does there still seem to be a focus on total distance as a key load monitoring metric?
A simple answer is that total distance is very easy to understand. We all know what a metre is, what a kilometre is, and how each of those apply to sport situations.
Tweet ThisIncreased availability and use of GPS wearables are driving an increase in the number of metrics available to monitor. Metrics range from easy to understand, like the number of decelerations to more complicated metrics like average metabolic power
@jakegillies
Total distance is one of the few variables with a locked in definition. High speed running bands or acceleration / deceleration zones can vary widely depending on the sport, the researchers, the technology providers, and the individual athlete. Total distance is a very easy option for programming and planning. Conditioning sessions or return to play sessions are often performed in a controlled, sterile context – without the chaos and dynamic nature of sport. That makes planning the number and length of reps a straightforward way to progress an athlete’s weekly distance.
Those factors make a reasonable case for using total distance as a key performance marker. But none of it guarantees that the GPS data is being interpreted and applied wisely.
Coaches and players, alike, can get lulled into looking only at the largest number, or the one at the top of the dashboard or leaderboard.
Players who come to check the daily GPS output may scan through the list until they see their name, and then look at one or two numbers relative to their peers. If a player sees that he covered 4 km and his positional competition covered 3.8 km, he might be satisfied with his performance for the day and may overrate where he stands in the depth chart. If the player who covered the least distance was the club captain with 60 international appearances to his name, total distance is not going to impact match day selection.
Coaches should work backwards from match or training session demands to determine which metrics, and what levels, are appropriate. This may require a bit of education across departments.
The players may also need some education, too. At a minimum, they should understand that all metres are not equal. I don’t use total distance as feedback to players. Instead, I aim to engage with them on metrics that fit our club identity and the way we want to play rugby. These metrics relate qualitatively to the game plan, but they are also good at quantifying volume, intensity, and density of our training sessions. Providing this feedback can allow players to ask better questions about their training.
Tweet ThisCoaches should work backwards from match or training session demands to determine which metrics and what levels are appropriate. The players may also need some education too. At a minimum they should understand that all metres are not equal
@jakegillies
Stable total distance can be unstable for other metrics
The six sessions below are all from MD-2 of a seven day turnaround for a starting outside back.

This graph shows us very little. A well planned and prepared coaching department will have certain levels of consistency and pragmatism in their session design, so you can be well prepared for these sorts of outcomes.
Let’s say that this coaching staff are not very logical in their design: the only point of consistency is session duration. These six sessions could end up with similar total distances but significant differences from one session to the next.
Session 1 is general 15 vs. 15 match play, where standard rules and regulations apply with reductions in contact. This session exposes players to the relative intensities of a match with lower overall volumes due to a shorter duration. There are several key metrics. Whichever metrics are most in line with the club’s playing philosophy will be most appropriate.
Session 2 focuses on defensive shape with very little in-possession play. This will lead to a large number of accelerations and decelerations, increasing the distance covered in these acceleration speed zones. The key metrics are based on or derived from acceleration.
Session 3 places a large emphasis on kicking for territory while keeping the ball in play. This requires outside backs to reach nearly 90% of their maximum velocity to make sure they are putting pressure on the opposition backfield. It is likely to be the most demanding session design for high speed outputs. Key metrics are high speed running (absolute and relative, across multiple bands), and sprint running (entries and distance).
Session 4 has a counterattack focus where the team employs a “run it back” approach. This has potential to be similar to the kick-chase session, but the players will not be running into open space so the volumes will be slightly lower despite similar efforts. The key metrics are the same as Session 3, plus high speed density due to the repeated nature of the drill.
Session 5 practices set piece attacks, where the ball will remain in play for a maximum of two phases. Shorter and fewer periods of the ball in play will reduce the relative intensities of the training session, but the players will still likely have moderate to large exposures of high speed running. The key metrics are similar to Session 1 plus, perhaps, a custom metric like HMLD that can provide an overarching figure on output.
Session 6 emphasizes high tempo transitions from attack to defence. This will be the most chaotic session, but will not necessarily have the same high demanding outputs because the ball in play will be constant with rules in place to keep a quick tempo. Relative intensities, meters per minute, or high speed runs per minute are the key metrics for observing how far above match intensity the team are training.
If we only looked at total distance for these sessions, we would miss massive fluctuations in other metrics. We could see a player experience double match loads for one particular metric in one week, followed by half a match load in the subsequent week.
Away from load management, we also have to use GPS to celebrate and evaluate players. How would we evaluate the strengths of one winger compared to the other in a kick-chase drill if we are not critically assessing their high speed outputs? How can we applaud the efforts of a key defensive player if we don’t know that he is achieving peak acceleration values every time he gets off the line?
Let’s say that the content of the sessions is similar from one to another, but on a preseason tour the coaches and players are under other constraints such as travel, using rented pitches, and being at the mercies of transport. The six sessions may again look like Figure 1. However, if you add in a simple component of duration, the sessions become very unstable when you examine them relative to the time afforded.
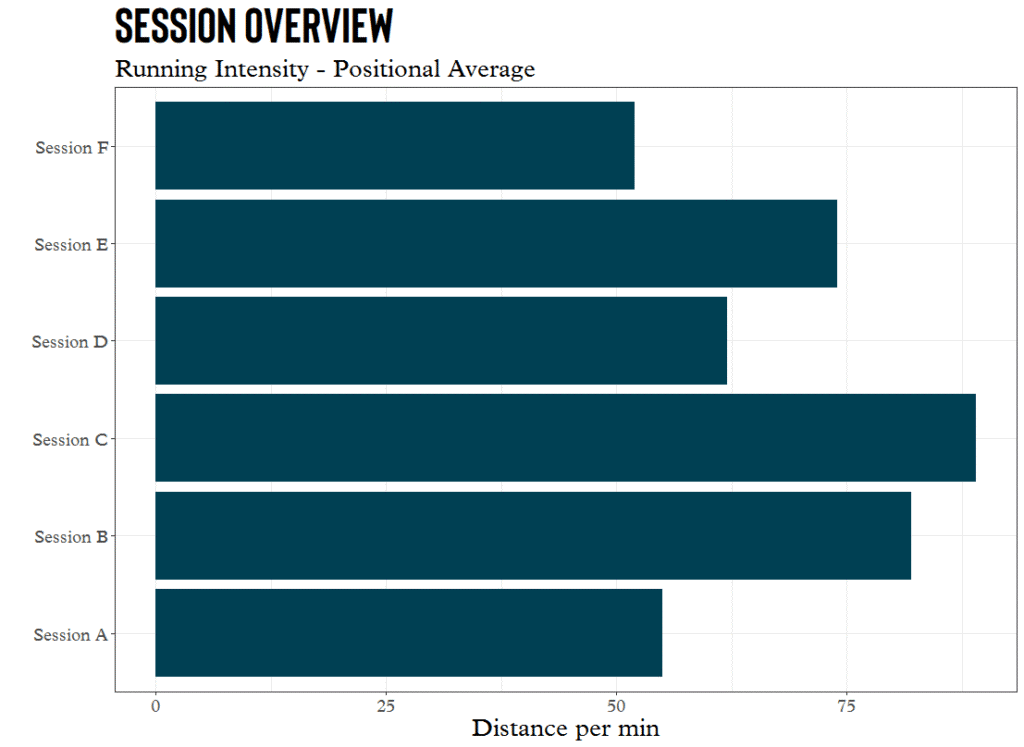
These two examples reveal the fluctuations in demands in one example, and fluctuations in intensity in the other. While some periodisation models advocate for variations and oscillations in these outputs, it is often in a planned and projected manner. The chaotic nature of the two examples here show why you have to look deeper than the surface metric of total distance.
Zeroing in on total distance in these examples may lead to over optimism in the training state of players, and you may miss a vital piece of information such as mechanical work done, or the intensity of work performed. Both could have a knock on effect that manifests during the match at the weekend.
Tweet ThisZeroing in on total distance may lead to over-optimism in the training state of players and you may miss a vital piece of information such as mechanical work done or the intensity of work performed
@jakegillies
Total distance as a marker in rehab / return to play
For a return to play athlete, total distance is a good indication of the overall volume that he is being exposed to. You could replace total volume with duration, frequency of sessions, or even a heart rate metric.
But looking at this as a key part of RTP will underprepare the player as they enter the middle to late stages of their rehab.
In the early stages, total distance is a valid an indicator of load, progression, and volume. For long term lower limb injuries, it could well be the most appropriate one. However, when you get further along the continuum of rehab, and the player is integrating back into training, the focus on total distance as a measure of volume should begin to decline in importance.
Fluctuations in total distance will not have that great of an impact on a player, within reason. If one of my players decided to run a half marathon, I would be concerned. However, if everything is taking place in a planned environment, I am far less fearful of fluctuations in total distance.
Second, focusing on volume metrics alone, irrespective of the specific metric, has the potential to disrespect the intensity and density of the training that the players are returning to.
Assessing intensity and density is as important as measuring the volume of a session. This is largely related to the team sport training sessions, and how we can prepare the team to play on the weekend. However, these variables play a part in returning an injured athlete to training.

Team sports training is chaotic, largely stemming from tactical and technical chaos and having to perform unanticipated actions. The RTP process will undoubtedly include this at some point, with drills that become closer to game scenarios. But when something looks like the real thing, how can we be sure that it is producing outputs like the real thing?
Tweet ThisTeam sports training is chaotic due to tactical and technical unpredictability, requiring unanticipated actions. The RTP process will include this, but when it looks like the real thing, how can we be sure it’s producing outputs like the real thing?
@jakegillies
We will regularly take match values, training norms, and weekly averages to build a player towards reintegration. But they can still often be unprepared for the pace and speed of the training when they step on the pitch. Taking peak periods of play and worst case scenarios of match play can help guide these RTP training drills to be closer to the real thing.
It can be extremely difficult to integrate a player who is on a strict budget of total distance. They could accumulate their target within the first half of an unusually pacey session and be forced to miss the most important part of the session in the lead up to the subsequent match. Within this period, they may not have been exposed to the higher velocity demands that was planned; or, perhaps they haven’t had the opportunity to be involved in contact based drills to clear a collision based injury. If the programme is guided by heart rate metrics, this player could be left short of certain internal load markers, although this is less of a problem with the multitude of off-feet conditioning options available in most settings.
On the other hand, they could be a third or fourth choice player who will not be in line for most of the training on offer, leaving them short of their target. This is less of an issue, and can be counteracted with top up sessions, although the nature of RTP means that these players may have hit the ceiling on what they can get out of sterile running. The focus at that point should be on integration with the sport. If a club is fortunate enough to have a large squad size, they can address this concern by running non-match day sessions for the non-selected or injured players.
Total distance still has its uses, but context is key. It is a reliable metric, but maybe not always appropriate. It is a valid metric, but maybe not always helpful.
Dig deeper on the meaning behind metrics, and more importantly, find out what is important to you and your athletes, what sort of game plan the head coach wants to play, and how you can you employ metrics to help your team succeed. Find out what can add value to the programme and how your GPS system can be a part of that process.
Tweet ThisTaking peak periods of play and worst-case scenarios of match play can help guide these RTP training drills to be closer to the real thing
@jakegillies