Reflexes are the fastest neural circuits in the body. They are the simplest and shortest connections, and they have no interaction with the cerebral cortex, which means they are involuntary. Reflexes are an individual’s response to their environment, and reflect their nervous system status.
Postural and balance reactions happen automatically: some people land safely like a cat, others are less lucky.
Reflexes are a component of all aspects of movement, so they are directly relevant to sport performance. Many tests and technologies measure reflexes and the reflexive components of more complex movements.
But if reflexes are involuntary and completely separate from the “thinking and learning” parts of the brain, can we train them? Answering that question will lead us to understanding the implications of reflexes for athletic performance.
Tweet ThisReflexes are the fastest neural circuits, involving the simplest connections with no cerebral cortex interaction, making them involuntary. They represent an individual’s response to their environment and reflect the status of their nervous system
@Sam_Leslie
Nerve reflexes and athletic movements
Nerve reflexes are incredibly fast. The speed of the reflex arc depends on the type of nerve fibres involved and the complexity of the reflex.
Simple, or monosynaptic, reflexes are the fastest reflexes. The patellar (knee jerk) reflex may be the most well known example. The signal travels along a sensory neuron to the spinal cord, where it directly connects with a motor neuron that sends the signal back to the muscle. This process can be as quick as 20-40 milliseconds. However, these are the less relevant reflexes for sport.
Complex, or polysynaptic, reflexes involve more than one synapse, meaning the signal passes through several neurons before reaching the muscle. The extra synapses slow down the transmission slightly, making polysynaptic reflexes a bit slower than monosynaptic reflexes.
The best example of a polysynaptic reflex is a withdrawal or flexor reflex, for example, pulling your hand away from a hot plate. Another is the postural reflex.
Postural reflexes act via the spinal cord, the brainstem, and cerebellum for balance correction. They do not involve the higher processing centres of the cortex, making them fast, working at 80-120 ms. The postural reflex keeps us from falling, e.g., when we trip over a tree root but get the foot down fast enough to save ourselves.
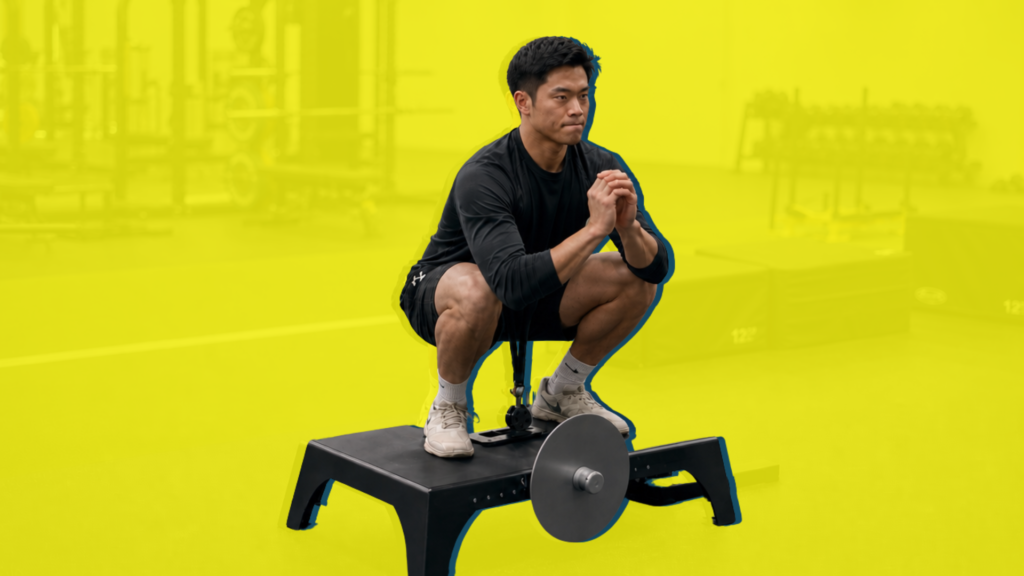
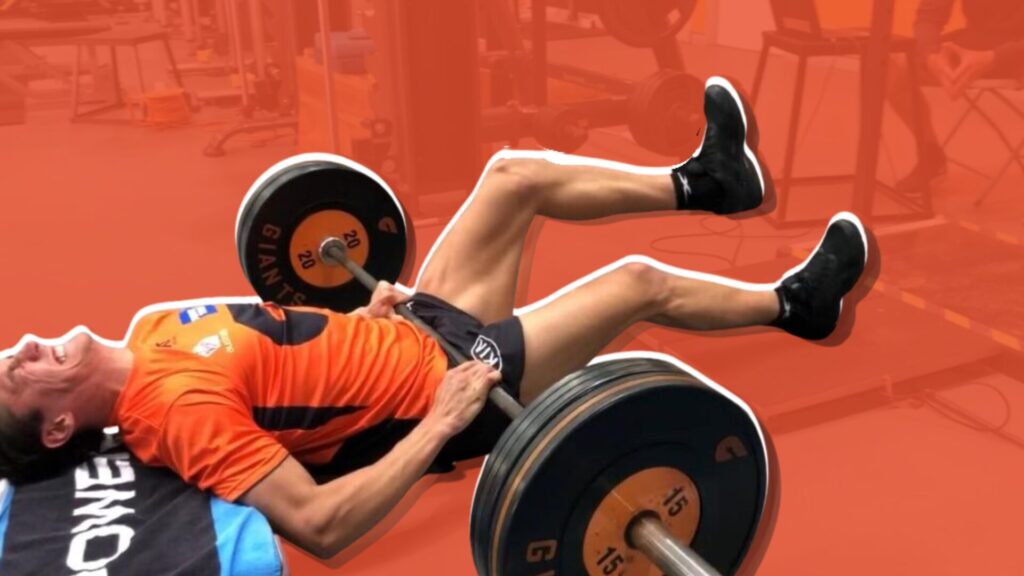
These reflexes have been adapted to eccentric reflexive training by manipulating the environment. An athlete who rapidly changes position in a split squat or catch a weight that is falling to the floor harnesses this reflex. This movement involves a high velocity eccentric component that transfers well to athletic pursuits. But it does not involve voluntary thought: the process stays below the level of cortical processing.
Tweet ThisPostural reflexes use the spinal cord, brainstem, and cerebellum for fast balance correction, bypassing cortical processing and activating in 80-120 ms. These reflexes have been adapted to eccentric reflexive training by manipulating the environment
@Sam_Leslie
Measuring reflexive components of whole body movements
If we can measure and track these types of reactions — if we can remove the conscious part of the athlete’s movement — we can gain insight into the athlete’s automatic, non-voluntary neuromuscular system. This can inform us about the state of the athlete in terms of rehabilitation or competition status, similar to how heart rate variability data can assist in determining the athlete’s parasympathetic state and overall readiness.
When practitioners set out to observe and measure reflexes, we are looking at very fast, involuntary eccentric movements.
Using force plates for a single leg jump, there are two distinct phases: the first 100 ms of landing from a jump (shown in the yellow oval in Figure 1), and the pre-jump eccentric loading phase (red oval).

Postural reflex: Landing phase, first 100 ms
Landing from a height will elicit a protective response from the athlete. No amount of landing training will change what happens in the first 100 ms of landing. This is the domain of the postural reflex. The force plate software is able to record this as the eccentric braking rate of force development (RFD) in the first 100 ms. Anything after that cannot be considered a reflex, as it would involve some voluntary control.
By measuring how much force the body can accept in the first 100 ms of landing we gain a picture of the nervous system’s ability to protect the joint. The higher force, the more stable and protected it is.
Eccentric braking RFD is an intrinsic measure of the neuromuscular system’s protective ability. When an athlete is injured, the eccentric braking RFD (100 ms) will be lower as a result of impaired proprioceptive and other sensory organ awareness, which reduce the ability of the reflex to respond to its environment.
As the athlete’s rehabilitation progresses, sensory organ firing improves along with the speed and function of the postural reflex, causing the eccentric braking RFD (100 ms) to rise.
Tweet ThisLanding from a height will elicit a protective response from the athlete. No amount of landing training will change what happens in the first 100 ms of landing. This is the domain of the postural reflex
@Sam_Leslie
Case example: Elite long jumper with osteitis pubis
In 2022, an elite male long jumper was diagnosed with symptoms of osteitis pubis (pubalgia). Upon initial force plate testing, eccentric braking RFD (100 ms) relative to body weight was 89 on left leg and 83 on the right leg (red and blue, respectively, Figure 2). The athlete’s right side was more symptomatic than his left; and the right leg consistently registered lower values. Tests were repeated at each session (weekly to fortnightly).
This athlete’s force plate testing data from previous years had demonstrated eccentric braking RFD (100ms) >100 on both sides consistently when he was performing full run ups at training. Full run ups are generally the last stage of training before a competition stimulus.
Therefore, the rehab and coaching staff set a goal of 100 for both left and right sides before the athlete could commence full run ups in training. He achieved this level in week 11 (Figure 2), three weeks prior to a major athletic meet that was going to be important for his World Championships rankings points. While we would have preferred a longer period at this functional level before returning him to the stress of competition, the risk to reward ratio was high.

Pre-meet testing in week 14 produced the peak of left 132 and right 170. At the meet, the athlete achieved a personal best, adding value to our faith in this measure.
However, his eccentric braking RFD (100 ms) dropped significantly after the competition and stayed low for many weeks, coinciding with a return of the athlete’s symptoms. It took the five weeks from week 15-20 for the athlete to return to full run ups in training, as dictated by symptoms and his data. After this, he returned to pre-competition levels.
Eccentric braking RFD progression thresholds
The coaching team believed that the setback after week 14 was due to the athlete’s relative fitness, as he had had only three weeks of regular training before a full six jump series at an international level competition.
In hindsight, and for future decision making, I believe a score of >131 was necessary for competition without exacerbating or resuming symptoms.
This metric is the result of applying a Fibonacci retracement to the eccentric braking RFD (100ms) range obtained during his pain free period of 2024 (Figure 3).
The 2024 (non-injured) range was from 127-170. The “STOP” condition (red), where competition should not be considered, was <131. The “CAUTION” (yellow) condition is between 131 – 146; and the “GO” (green) zone, where he should be clear to compete, was >146.

This retracement used data from the following year, but we could have just as well used data from an earlier year. That would have better informed our decision making processes, emphasizing the importance of collecting data from athletes in pain free periods.
Landing from a height is reflective of the athlete’s ability to perform a protective postural reflex, but only when measured in the first 100 ms. That data provides a guide to rehabilitation status and a way to intrinsically determine how the body measures its own neuromuscular health.
However, there is another part of the single leg jump that is also a reflex. That is the “stretch reflex” that precedes the shortening cycle (concentric contraction) of the jump, which can be measured as the eccentric deceleration rate of force development.
Eccentric deceleration RFD
The stretch reflex that initiates the jump start in Figure 1 (red circle) is recorded as eccentric deceleration RFD by the force plate. This reflex takes just 30-50 ms, so we know it involves no cortical control. It is a measure of how the body is reacting to its “neuromuscular environment.”
A slower contraction will occur when the body is less willing to load the connective tissue eccentrically — due to pain or inflammation, for example — resulting in a lower score. Given the speed of the reflex, there is no way for the body to override this inhibition through descending cortical input. Therefore, eccentric deceleration RFD is an excellent measure of the athlete’s local neuromuscular health. However, it’s important to note that it should be used relative to previous measures – not as an isolated, acute assessment.
Figure 4 shows similar behaviour between the eccentric deceleration RFD and the eccentric braking RFD in Figure 2. The right (more sympomatic) leg has lower values until the very end of the measuring period. Again, there is a steady — if not as dramatic — improvement leading up to the target meet in week 14.

Performance dropped after this meet, again not as dramatically, before steadily improving after just one week. Remember that five weeks passed before eccentric braking RFD started rising again.
One hypothesis is that because the stretch reflex is shorter it has fewer components, so it may not be affected as much by symptoms or fatigue associated with recovery.
Eccentric deceleration RFD progression thresholds

As before, a Fibonacci retracement to the eccentric deceleration RFD/BM data from his pain-free period in 2024 outlines the go / no-go ranges.
The 2024 (non-injured) range was from 132-232. The “STOP” (red) values where the athlete should not compete is <170. From 170-194 is the “CAUTION” yellow range, and >194 the athlete should be clear to compete.
Interestingly, applying this data would have prevented the athlete from jumping in the important international competition at week 14, but he would have returned to competition earlier, in week 21, using the yellow zone as the guide.
Coaches can use this data to aid in the decision making process. Each coach will have their own preferred metrics, which will (of course) complement their coach’s eye and the athlete’s overall performance in training.
Eccentric deceleration phase duration
Eccentric deceleration phase duration is the time that elapses during the stretch reflex.
Like the other metrics, we expect this reflex will be slower if the athlete is more symptomatic, as the athlete’s autonomic systems will influence the speed of contraction beyond their voluntary capabilities.

As in Figures 2 and 4, the results demonstrate steady improvements (shorter durations) until the meet, followed by a noticeable slowing of eccentric duration (stretch reflex) immediately afterwards (week 15). The right (symptomatic) side trailed the left for more weeks than the other metrics, before eventually “catching up” to the left over the remainder of the season. We need more information to understand this phenomenon. However, if the reflex can be modified through training, focusing on the athlete’s symptomatic right side would be beneficial, which brings us to how we worked this into performance improvements.
Reflex monitoring for performance
This is the same athlete 12 months later and asymptomatic. The data is from the four months leading up to his PB and Olympic qualification jump of 8.34 m.
The first case example demonstrated how tracking the eccentric reflexes or high velocity eccentric activity of a single leg jump can help track an athlete’s rehabilitation. At this stage, we’re addressing the following questions:
- Do the measures used in the first case example plateau, or could we keep using them indefinitely?
- What measures best relate to his “athletic peak?”
- What training methods yielded the most significant changes to this data?
Eccentric braking RFD (100 ms)

Figure 7 contains four months of data that capture the postural reflex, measured as the eccentric braking RFD in the first 100ms.
While there is a trend towards improvement by the time of his PB, the range is small and tends to average close to the 2023 maximum values of 157 for the left and 170 for the right. His averages during this period are considerably higher than the 2023 data: 150 compared to 107 on the left, and 127 compared to 99 on the right.
Eccentric braking RFD (100 ms) does not appear to be a strong predictor of readiness / performance. It may have approached its ceiling, therefore suggesting that it provides more insight for rehabilitation than for performance due to its relationship with the postural corrective reflex.
Eccentric Deceleration RFD/BM

Eccentric deceleration RFD/BM, which reflects the “stretch reflex,” was consistent across the training period for the left leg, but the right leg started lower before gradually improving to match the left by the time of the personal best.
The left leg average of 204 is close to the 2023 maximum value of 215, demonstrating that it had perhaps approached its ceiling.
Most of this athlete’s injuries have been on his right side, and the 2023 injury that set these studies in motion was more symptomatic on the right side.
Like eccentric braking RFD (100 ms) and the postural corrective reflex, the “stretch reflex” force measured as eccentric deceleration RFD indicated that the left leg had hit its ceiling, but the right leg was showing residual signs of being in end stage rehabilitation that resolved just prior to the Olympic qualifying jump.
Two takeaways emerge from this analysis. First, the more consistent side (left, in this case) should be used as the upper level for the opposite side to reach, in addition to being an indicator of readiness if it surpasses its own average.
Second, interventions should focus more on the inconsistent side (right) until it reaches the levels of the consistent side. In this case, the two sides reached parity approximately at the same time as the athlete’s PB. Therefore, we could also see this an “athlete peak” indicator.
Figure 8 indicates that focusing on the side with the lower force production and inconsistent values of the stretch reflex is more likely to be associated with a personal best performance.
However, what is going to give us our best indication that training is progressing in the right direction, and what can we do in training to influence this?
Tweet ThisEccentric braking RFD (100 ms) does not appear to strongly predict readiness/performance. It may have approached its ceiling, therefore suggesting that it provides more insight for rehabilitation than for performance due to its relationship with the postural corrective reflex
@Sam_Leslie
Eccentric peak velocity

Figure 9 displays the eccentric peak velocity during the “stretch reflex” during this four month period. The velocity correlated strongly with training progression and personal best performance in week 25.
A Fibonacci retracement from previous data collection created an indicator for the coaching team on how close the athlete is to peak performance. In this case, eccentric velocity >0.986 m/s might indicate that the athlete was approaching peak condition, and a value >1.05 m/s (which he achieved at the time of his PB jump) would be our goal.
Can we train to achieve faster reflexes?
Plyometrics and reactive strength training are established methods for training the stretch reflex as part of the stretch shortening cycle (SSC). Novel techniques like eccentric reflexives will also harness the neuromuscular aspects of the reflex loop.

However, one part of the reflex loop that is largely ignored is the sensory stimulus. Increasing the sensory input can improve motor output [1]. Eversull et al., (2001) demonstrated that increasing the firing rates of the muscle spindle sensory organs by moving the joint 5 – 15% from the neutral zone led to improved motor outputs (Figure 11).

The preferred method to achieve this is by moving the joint into a position of relative flexion or extension in order to increase the firing rates of the sensory and motor organs. This, in turn, can selectively increase the activation of the flexor or extensor motor neuron pools [3, 4].
Our athlete needed more stimulation to the extensor motor neurons, particularly on the right (symptomatic) side. We programmed several exercises — known as direction bias exercises —that focused on moving his right side into a position of relative extension (Video 4 and 5).
Tweet ThisOne part of the reflex loop that is largely ignored is the sensory stimulus. Eversull demonstrated that increasing the firing rates of the muscle spindle sensory organs by moving the joint 5 – 15% from the neutral zone led to improved motor outputs
@Sam_Leslie
Complementing these were several resistance exercises to address force development that were preferentially selected to focus on the extensor motor neurons [5] (Video 6 and 7). The selection of these exercises is an example of “direction bias gym programming.”
By combining the sensorimotor stimulation of low load repeated movement direction bias exercises with the direction bias gym programming, the athlete was able to demonstrate within and inter-session improvements in symptoms (rehabilitation phase) and force plate data (performance phase).
Reflexes avoid conscious control, so they can be considered a strong indicator of neuromuscular health. The postural reflex and stretch reflex can both be approximated through force plate data points in a simple single leg jump, by monitoring eccentric braking RFD and eccentric deceleration RFD, respectively.
Tracking this over time and collecting data for the athlete can allow the clinician to make inferences as to how rehabilitation is progressing, and if the athlete is approaching peak performance levels.
Tweet ThisBy combining the sensorimotor stimulation of low load repeated movement direction bias exercises with the direction bias gym programming, the athlete was able to demonstrate within and inter-session improvements in the rehabilitation phase and performance phase
@Sam_Leslie