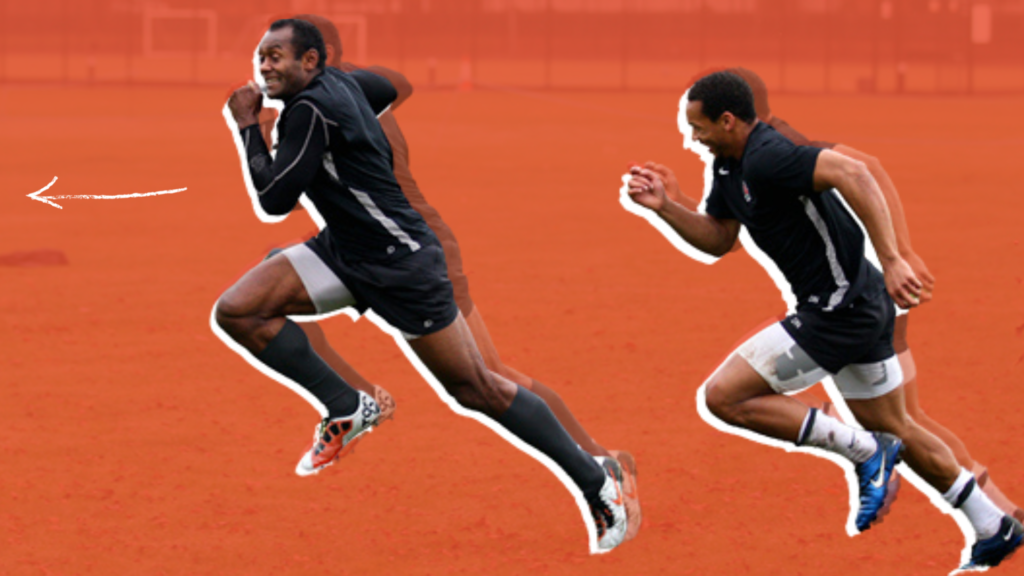
Many strength & conditioning coaches were athletes at some stage in their life. Their strengths often lay in the physical side of performance, as that’s what drew them towards the field. They feel confident delivering gym-based interventions and conditioning work.
This leaves a gap in our skill set: speed development.
Unless a coach comes from a track background, they likely don’t have direct experience in environments that rigorously coached sprint mechanics. Concepts like posture, projection, and front-side mechanics weren’t part of our education.
That gap has narrowed considerably over the years, and sprint mechanics have become less of a blind spot and more of a conversation S&C coaches feel equipped to have.
But knowing what to look for and being able to measure it consistently are two different things. Then there are the additional challenges of having a large squad of players, limited time, and no objective data to confirm your coach’s eye. Did that cue change the athlete’s shin angle, or did it just look slightly different? Is that athlete’s force application improving week on week, or are you seeing what you want to see? Without data, we’re largely guessing.
The most accessible tool for most practitioners is slow-motion video on a phone or tablet. It is free, portable, and reasonably effective at capturing what’s happening during a sprint.
For some things, such as an obvious overstride, it is good enough. But for assessing subtle mechanical changes across a squad consistently and over time, it becomes impractical very quickly. Manually scrubbing through footage and drawing angles by hand is time-consuming, and the analysis remains largely subjective. Two coaches watching the same footage could draw different conclusions.
Lab-based motion capture offers precision, but for research contexts, not weekly field sessions. Force plates provide another partial answer. The data on ground contact and force production are genuinely useful, but force plates capture what happens in a fixed position. They can’t tell you how athletes apply forces and how things change across multiple steps of a full sprint.
This article will show how we used Forceteck’s SprintAI to bridge the gap between our coaches’ eyes and objective, quantitative data.
Tweet ThisManually scrubbing through footage and drawing angles by hand is time-consuming, and the analysis remains largely subjective. Two coaches watching the same footage could draw different conclusions.
@jonobward
Case study #1: Confirming what the eye sees
Part of the challenge with traditional video review is that you can see something happened differently, but you can’t always be sure it happened for the right reason, or whether the change was meaningful. The comparison feature in SprintAI shows two runs side by side, from the same session, between different sessions, or between athletes.
Figures 1 and 2 involve the same athlete performing two 10-metre runs in a single session, with feedback between runs.
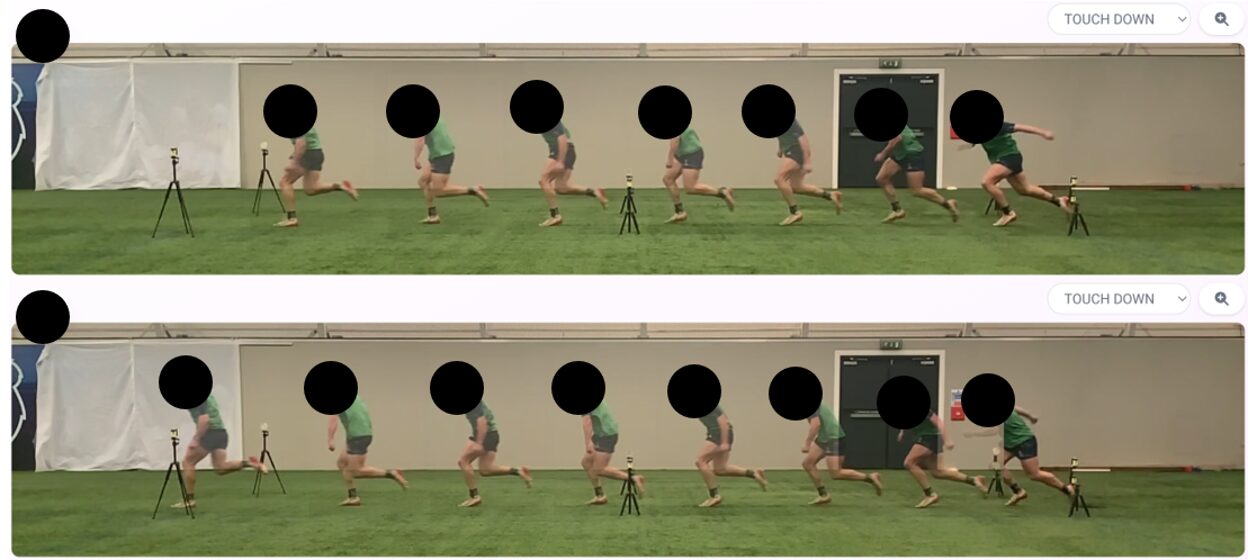
This is a young and powerful athlete. His force production was not the issue. Rather, it was how he oriented his force, as he would pop up early when accelerating. This is often the case with rugby players, who need to have their eyes up while running to take in information.
The specific cues focused on his shin position on his zero step: “roll over ankle and project out as far as possible” and “rise gradually with each step”. We also worked on striking back under his hips rather than “pulling”, as landing in front of the hips generates braking forces at the expense of propulsive force.
Figure 3 shows that after the cueing his shin angle decreased over the first three steps. This indicates that he was orienting his force more horizontally and was then able to attack back under his centre of mass more effectively.
Force metrics (Figure 4), derived from SprintAI, showed that the magnitude of force was less at the start of his run. Yet towards the end of the 10-metres he was producing higher force.
By dialling back his aggression and focusing on technique, the gradual propulsive peak force generation allowed a more fluid progression of the run, without the drops in propulsive force seen in the first run.

Tweet ThisBy dialling back his aggression and focusing on technique, the gradual propulsive peak force generation allowed a more fluid progression of the run, without the drops in propulsive force seen in the first run.
@jonobward

Filtering data through coaching frameworks and philosophies
Any data is only as useful as the framework through which you interpret it.
Speed is both trainable and teachable. Mechanics, posture, and rhythm are qualities that coaching can improve.
There is no single perfect sprint technique. Elite sprinters achieve world-class performances using slightly different movement strategies. Our role is not to force uniformity, but to help each athlete move more effectively within their own bandwidth. This is especially relevant in rugby, where athletes range from 80–130 kg.
Physical qualities support technical expression. Strength, power, stiffness, and elasticity underpin an athlete’s ability to project, switch, and interact with the ground. Technical changes may not stick if the physical capacities which support them are absent.
With that in mind, coaches should keep speed sessions simple and clear. Rather than overloading athletes with multiple cues, focus on one cue linked to one desired outcome. This keeps intent high and makes feedback actionable.
During acceleration, two useful coaching words are “projection” and “orientation.” Projection is how an athlete launches forward and generates horizontal drive. Orientation is how they position their body to direct that force. If an athlete rises upright too early, or is bent at the hips, they lose the ability to keep applying force horizontally. The objective is simple: apply as much force as possible down and backwards.
During maximum velocity, the focus shifts from pushing towards bouncing. “Stiffness” and “reactivity” are the mantras. Stiffness allows the athlete to resist collapsing during ground contact, while reactivity is how quickly they rebound off the ground.
Together, these influence contact time and the ability to maintain speed.
Front-side mechanics should be a significant emphasis at maximum velocity. The thigh blocking should be around 90° in front of the body before attacking the ground from above. The aim is to spike the ground and get off it quickly, avoiding casting out (reaching with the foot) or spending excessive time on the ground pushing.
Tweet ThisPhysical qualities support technical expression. Strength, power, stiffness, and elasticity underpin an athlete’s ability to project, switch, and interact with the ground. Technical changes may not stick if the physical capacities are absent.
@jonobward
Case study #2: Tracking progress over time
Knowing whether you are having a lasting impact on an athlete’s mechanics, across weeks and months and not just within a session, is one of the harder questions to answer in speed development.
I would describe this athlete as a bruiser: physically dominant, excellent in contact, and someone who imposes himself on the game.
His sprinting, though, left a lot on the table. Upon arrival, he ran with a pronounced forward trunk lean. In rugby, this has some utility, as you don’t want to be upright going into contact. But the same posture that wins him the collision was limiting his sprint performance. The trunk lean impaired his leg swing mechanics, his orientation of force was suboptimal, and he ran with a lot of kickback.
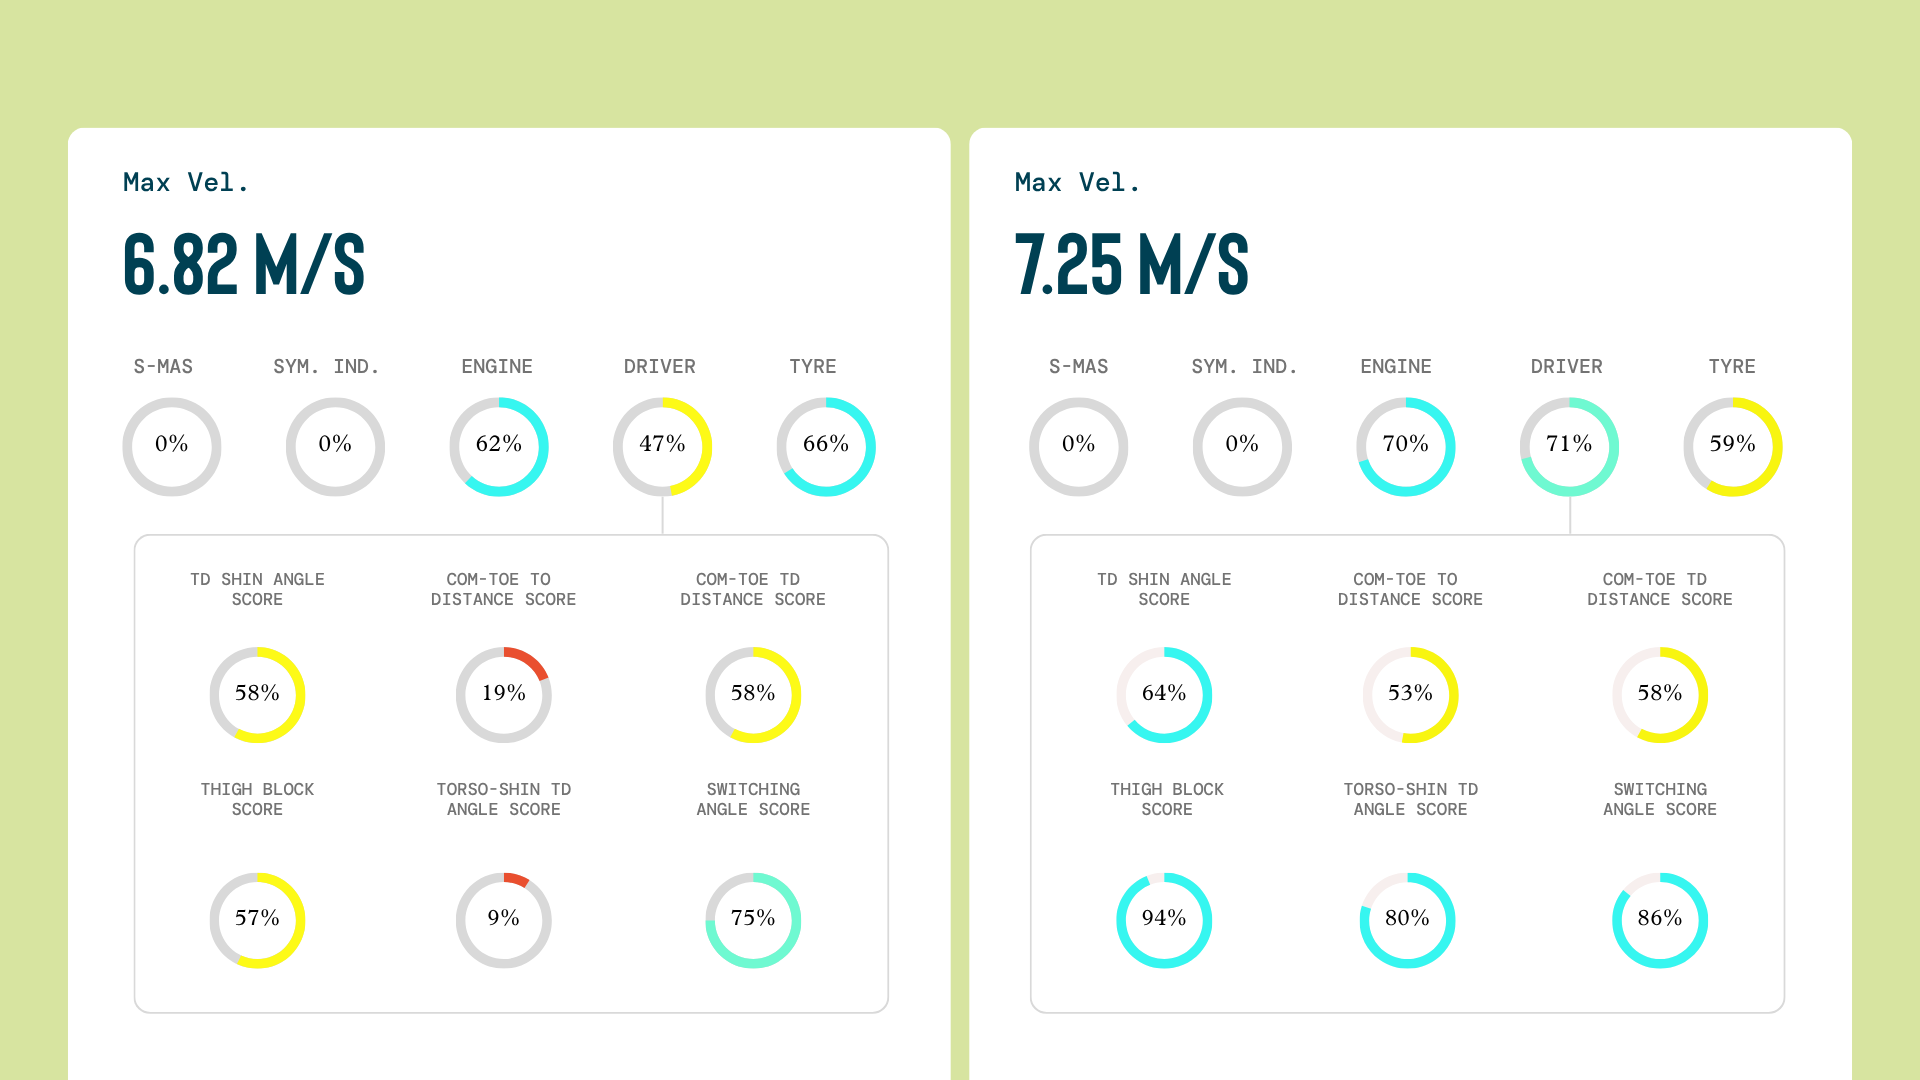
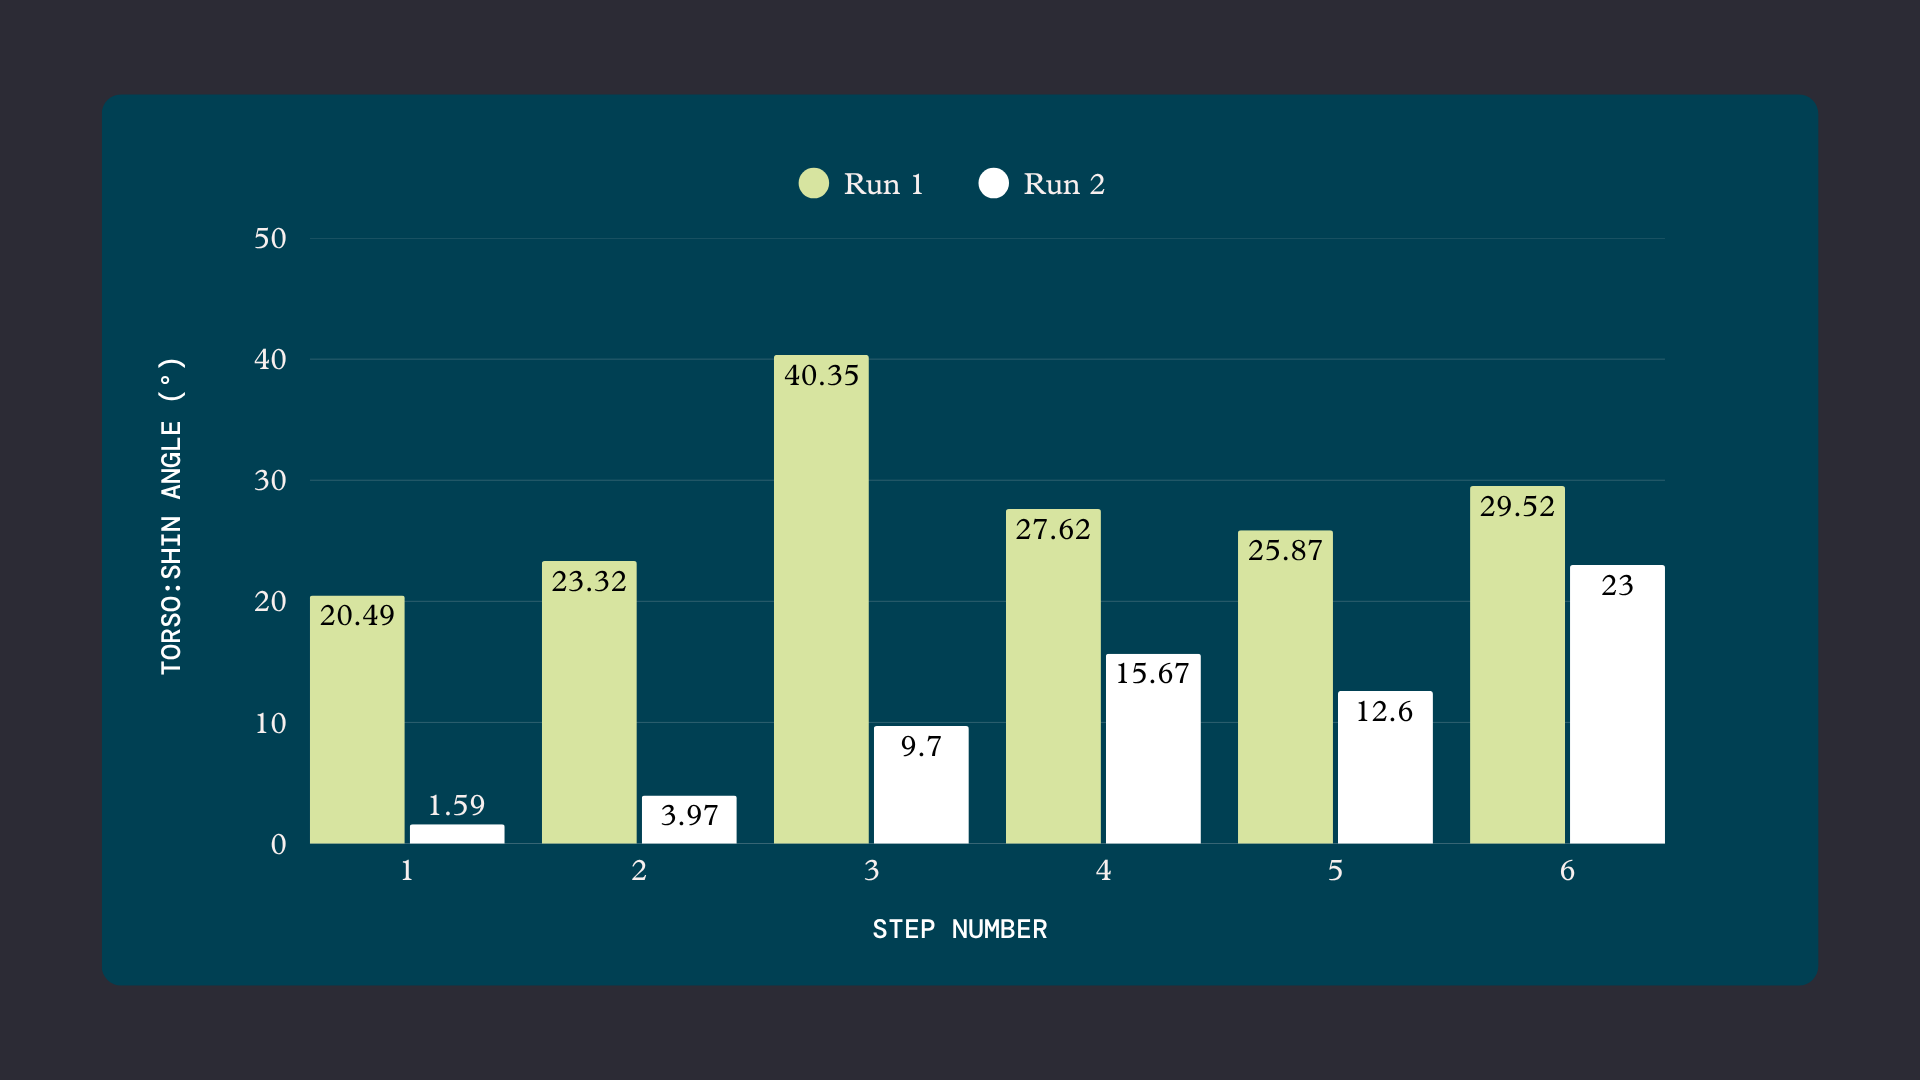
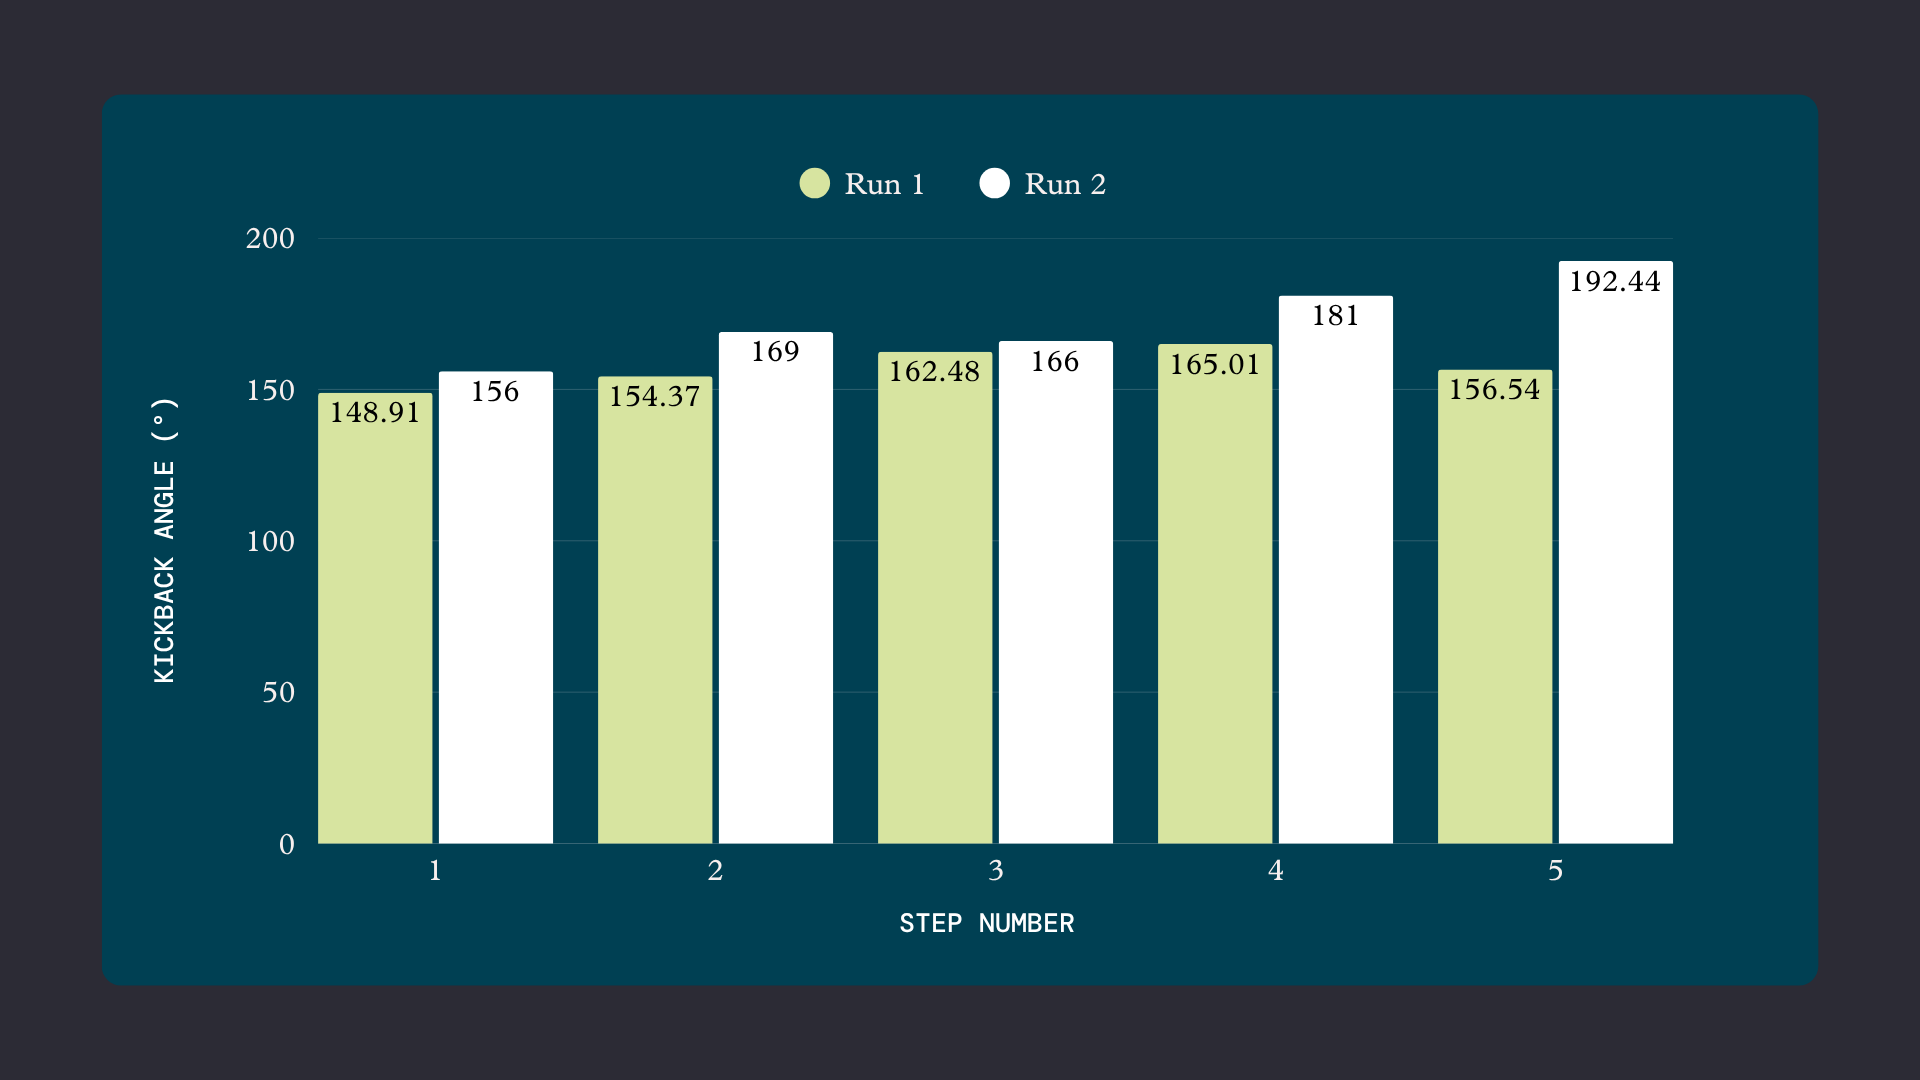
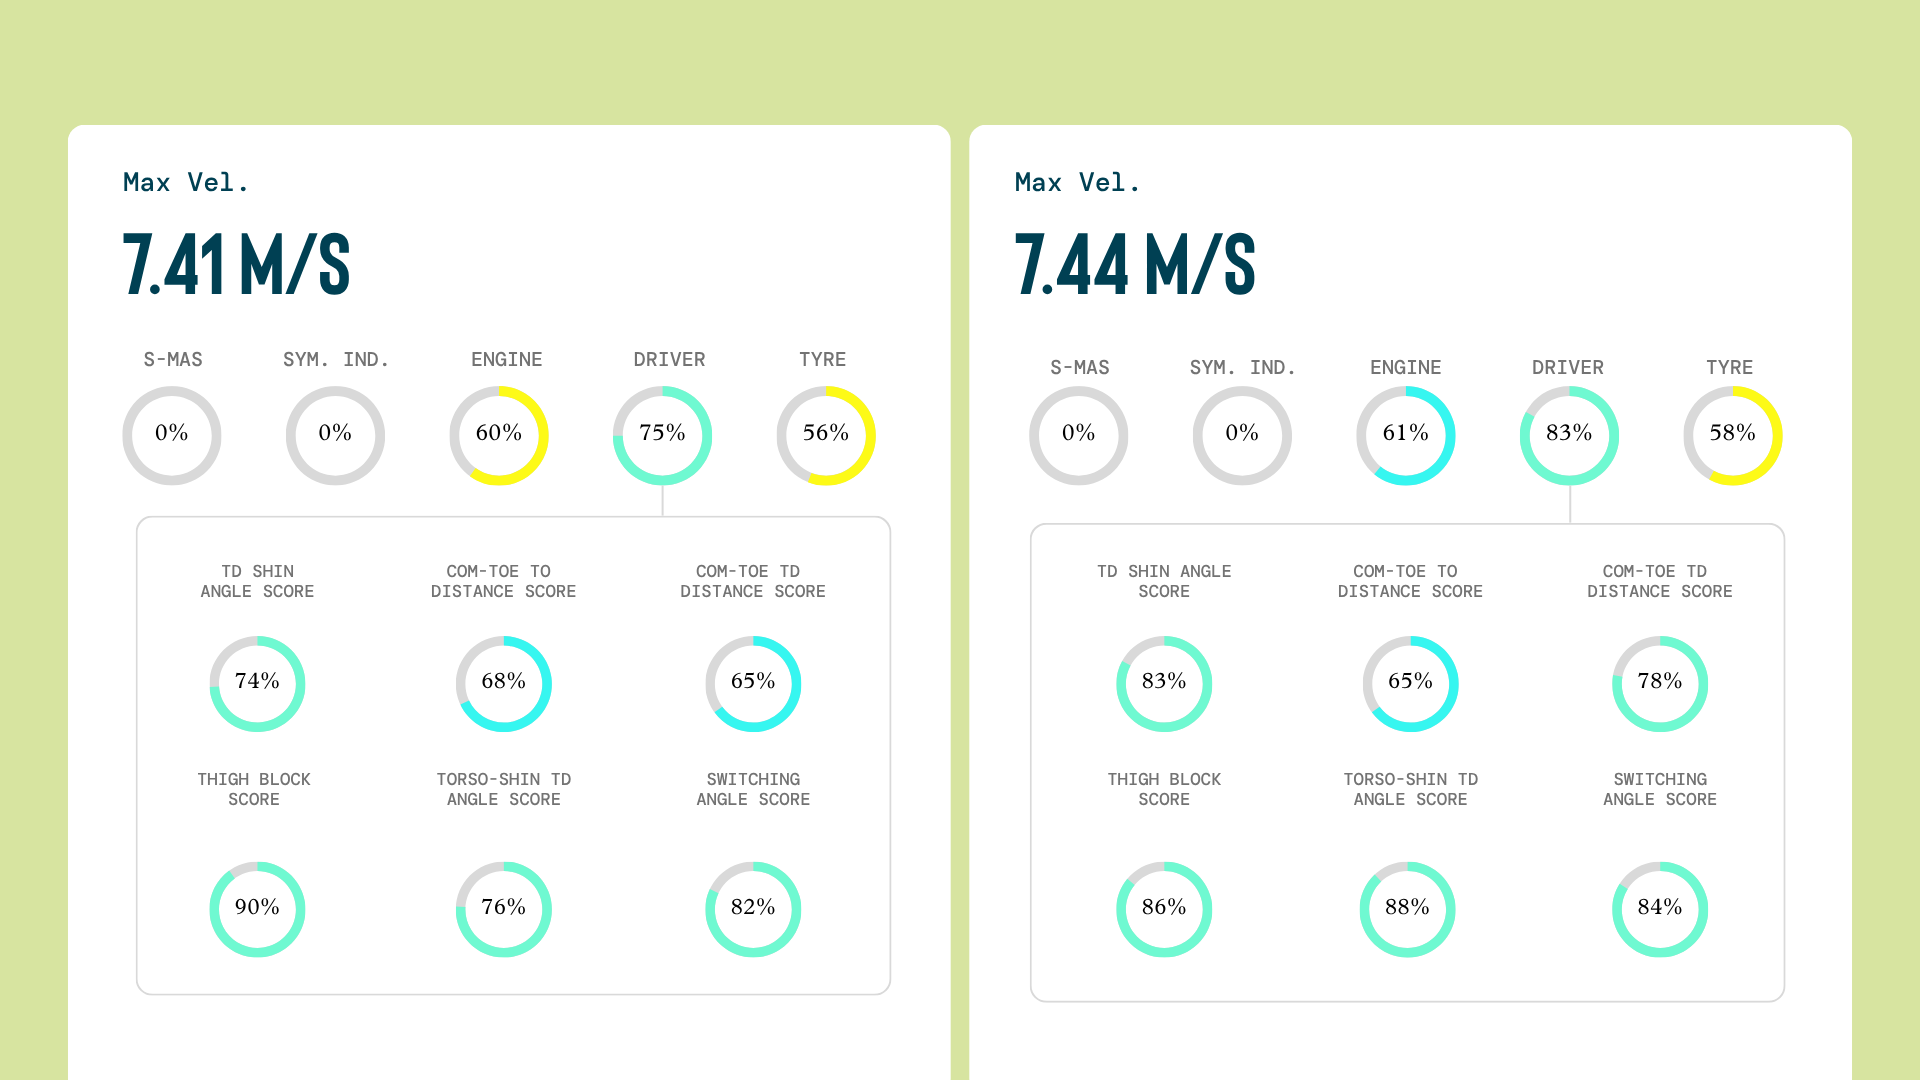
Over a six-month block, the intervention focused on three things: addressing his trunk and thigh posture, cueing him to strike back under his hips, and encouraging hip flexion-led swing recovery rather than knee flexion-led recovery. SprintAI derived data confirmed what we observed: he improved session by session, with significant changes emerging over time (Figures 5–7).
In his first month, his average maximum velocity at the end of 10m was 6.85 m/s. By the sixth month, that rose to 7.44 m/s: an increase of 8.6%. His split times told the same story, with his 5m time improving from 0.96s to 0.94s (~2.1%), 10m time from 1.68s to 1.64s (~2.4%), and 40m time from 5.43s to 5.32s (~2.0%).
Tweet ThisOver a six-month block, the intervention focused on three things: addressing his trunk and thigh posture, cueing him to strike back under his hips, and encouraging hip flexion-led swing recovery rather than knee flexion-led recovery.
@jonobward
Understanding the scores
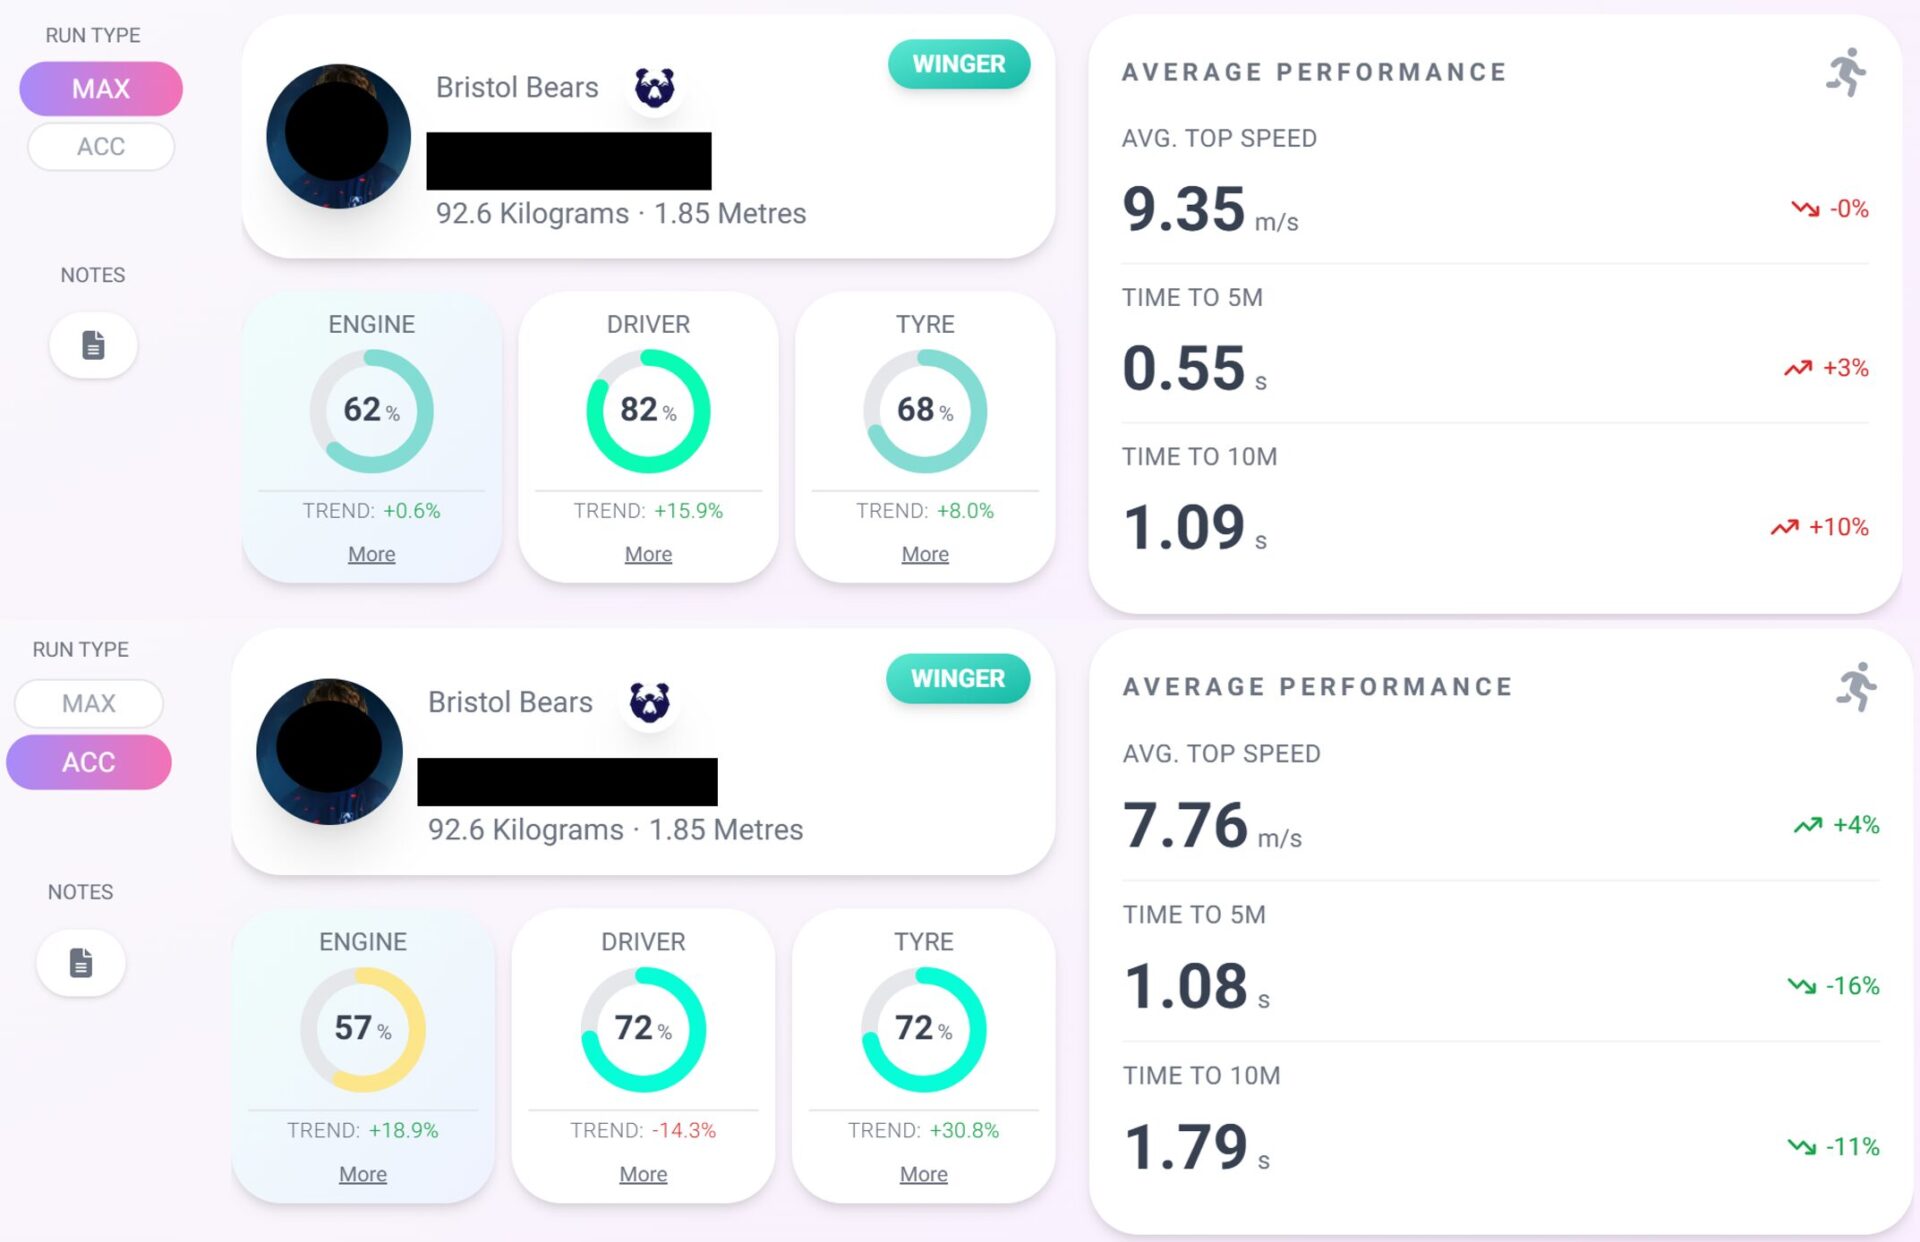
When you open any athlete’s profile on the Forceteck app, the landing page (Figure 8) shows top speed achieved over 10m and max velocity over your chosen distance, which in our case was 40m, averaged across the last five runs.
The dashboard also shows three composite scores: Engine, Driver, and Tyres. These can be toggled between acceleration (ACC) and maximum velocity (MAX) phases.
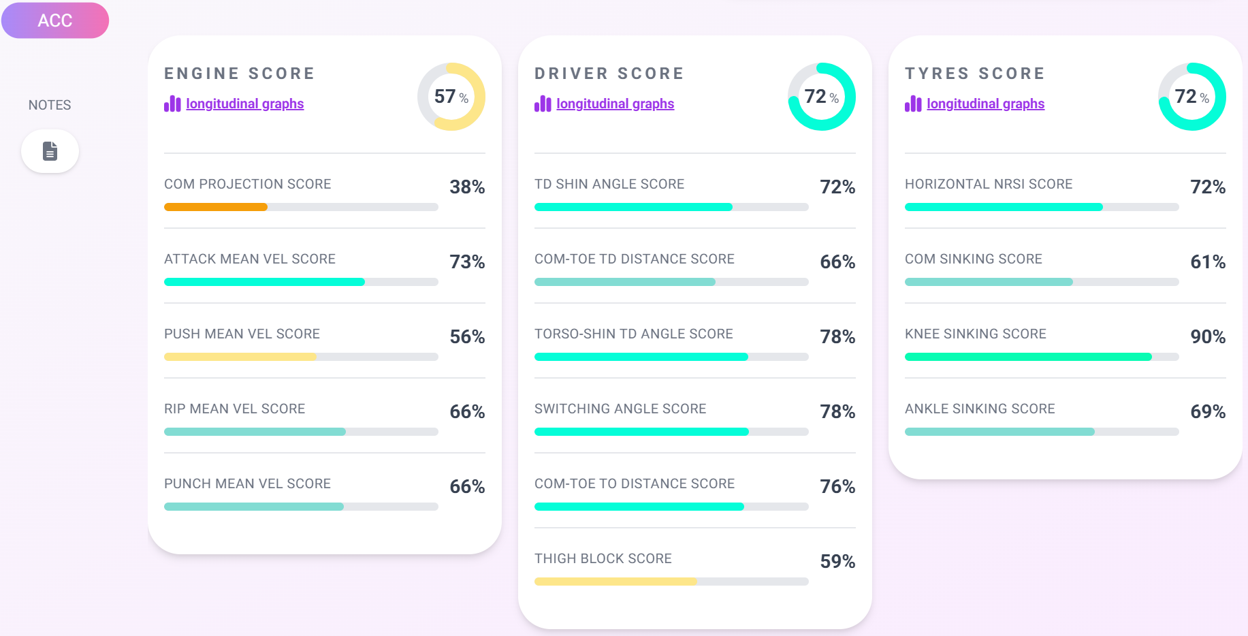
The Engine score reflects how well an athlete produces force and their thigh velocities. It is influenced by centre of mass projection and the angular velocities of the thigh during the attack, push, rip, and punch phases (Figure 9). Without SprintAI, identifying force production issues meant relying on timing gates and subjective observation of limb speed. SprintAI quantifies those attributes in a single score.
The Driver score captures how effectively the athlete positions their limbs during the stride from touchdown positions, switching mechanics, thigh block angles, and foot placement relative to the centre of mass. This is the athlete’s technical movement quality. Where previously I might cue an athlete on their shin angle and rely on the next session’s eye test to see if it changed, the Driver score tells me whether the intervention moved the needle.
The Tyre score reflects how efficiently the athlete interacts with the ground, i.e., the athlete’s stiffness and reactivity. It is influenced by centre of mass sinking, joint range of motion during stance, and reactive strength measures.
Tweet ThisThe Engine score reflects how well an athlete produces force and their thigh velocities. It is influenced by centre of mass projection and the angular velocities of the thigh during the attack, push, rip, and punch phases.
@jonobward
Case study #3: Sprint mechanics assessment score (S-MAS)
The sprint mechanics assessment score (S-MAS) objectively tracks mechanical changes. The S-MAS evaluates movement quality of the lumbopelvic region, backside mechanics, and overstride patterns, with higher scores reflecting suboptimal mechanics.
Whilst the S-MAS is a valuable tool, manually scoring each item across both limbs from video footage is time-intensive. SprintAI captures and analyses 2D video, calculating S-MAS for both the left and right legs across the whole squad.

Figure 10 shows how Forceteck SprintAI presents the S-MAS. The left side shows the last five runs of one athlete, while the right side is a single run. This is useful when tracking changes between sessions and over training blocks.
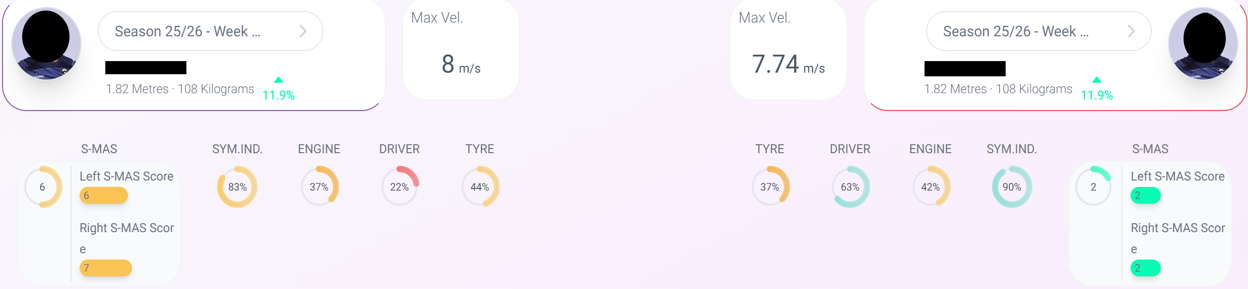
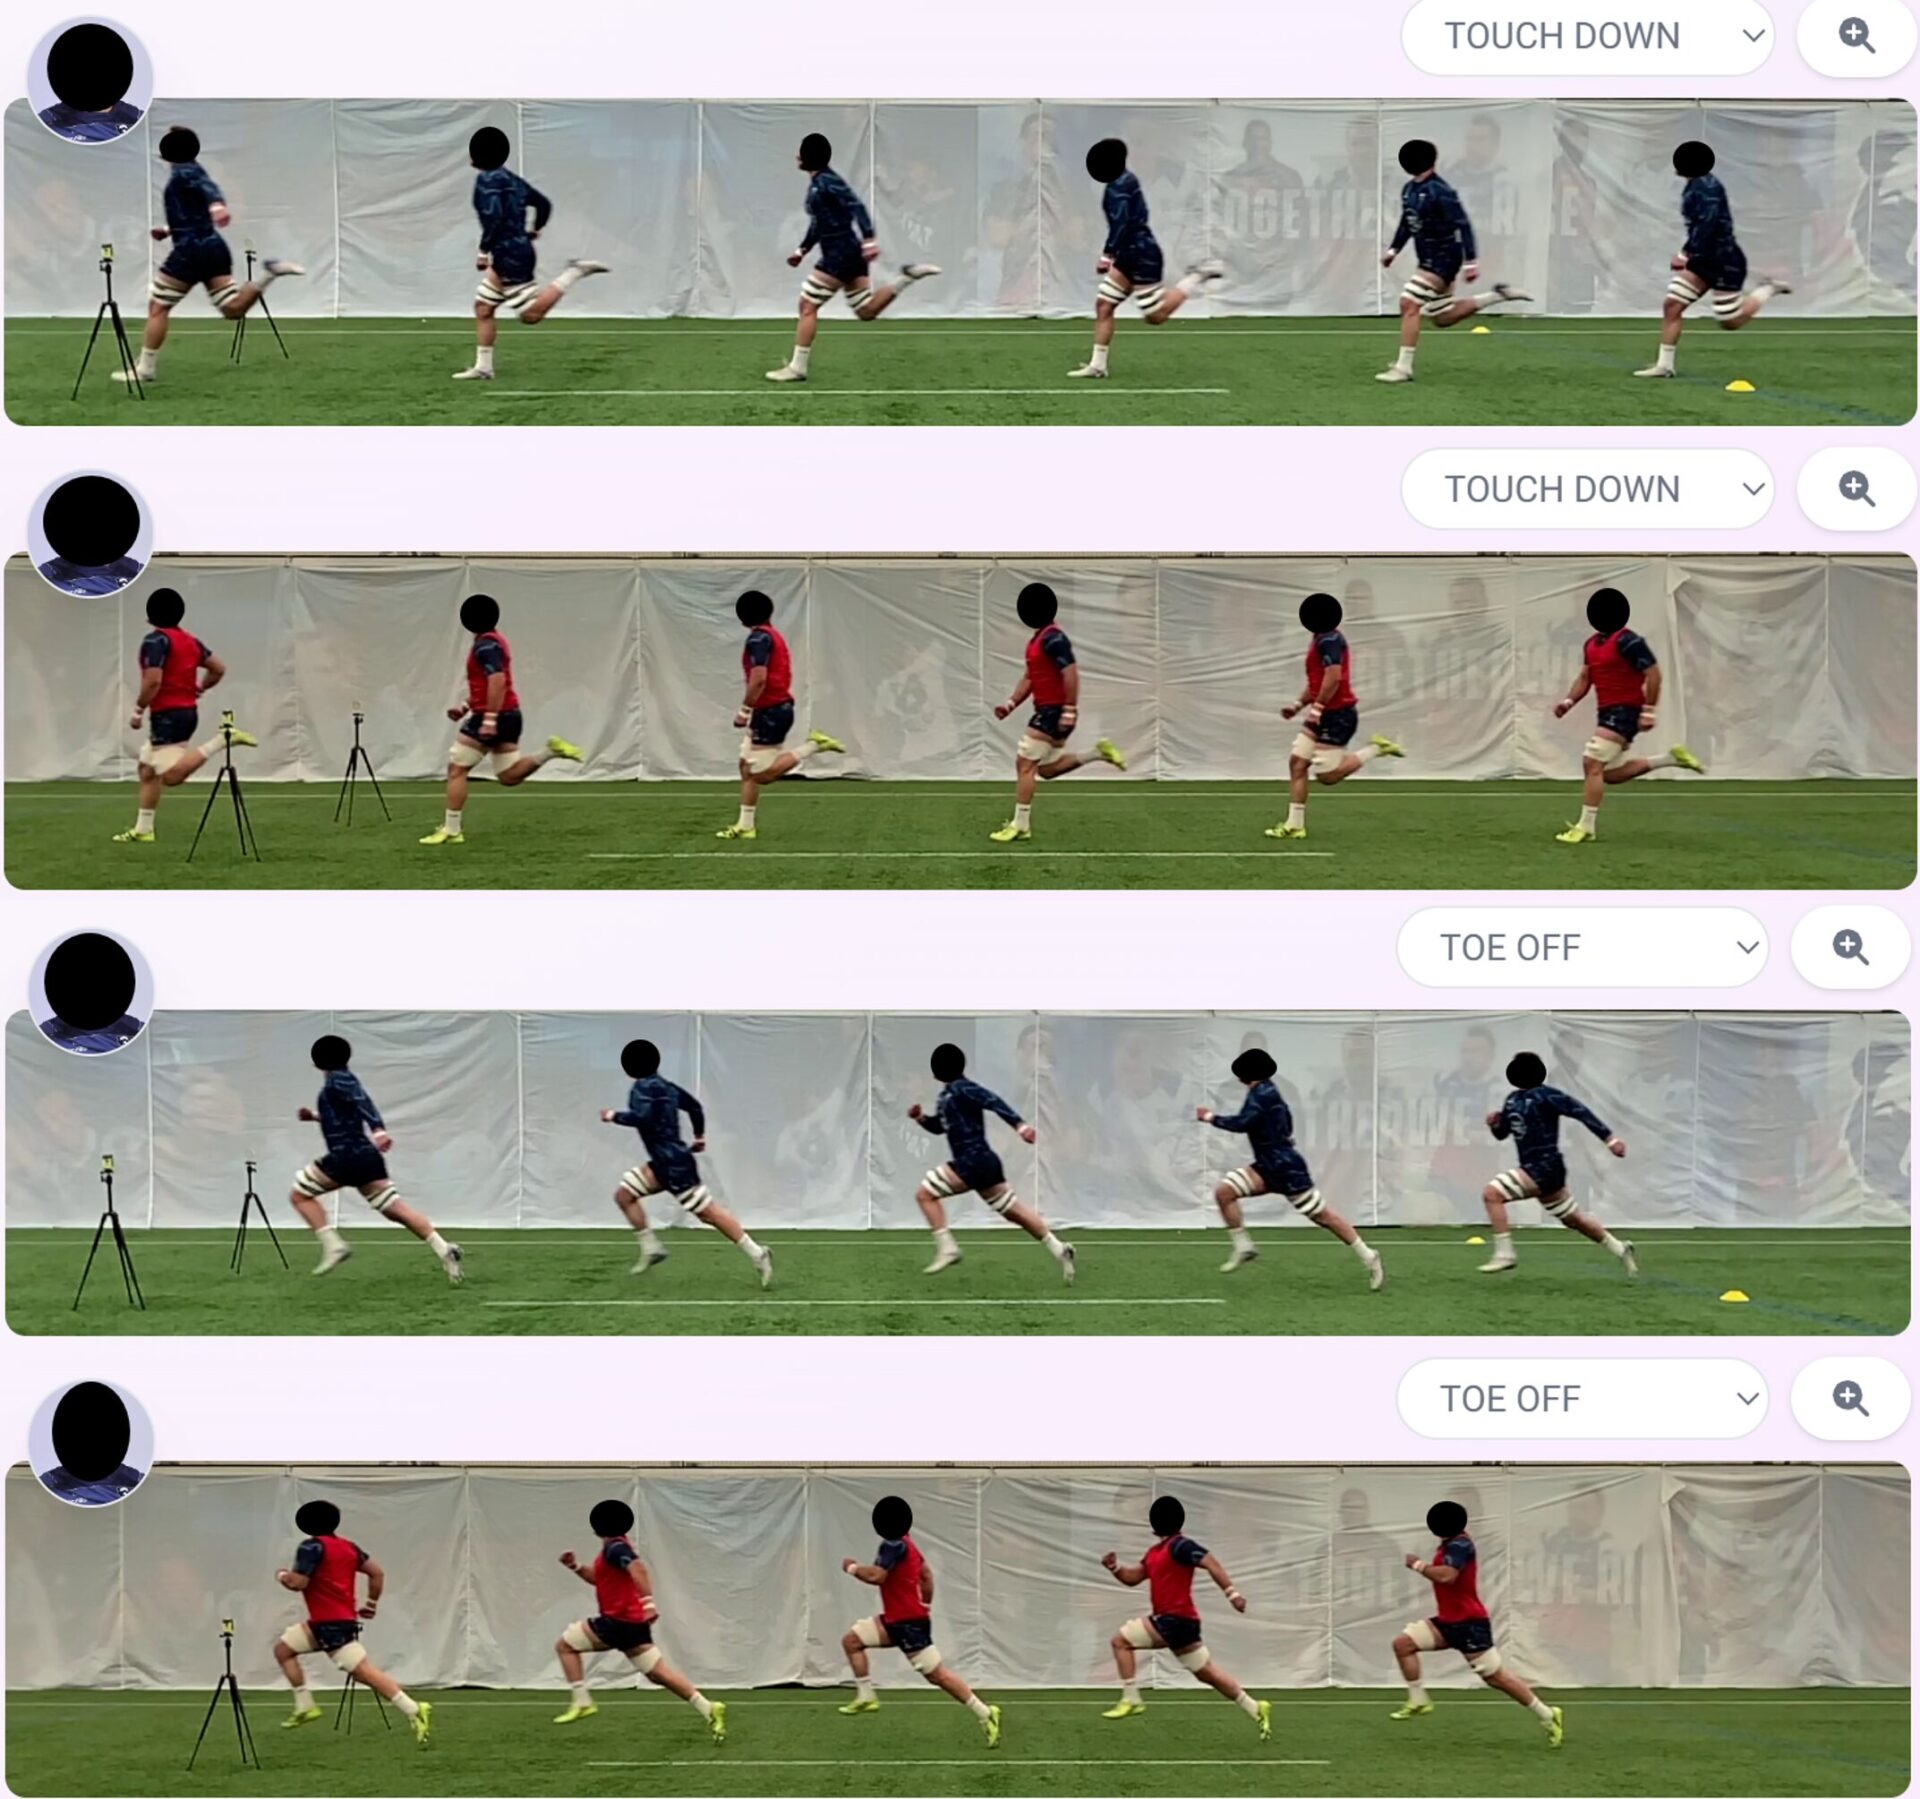
Figure 11 shows the outcome of an education session with a player about his running technique using the SprintAI video and kinograms. This discussion was based around his trunk and thigh positioning, notably on the swing phase recovery. During his speed preparation, he consciously focused on an upright “stacked” torso, which automatically improved his front-side mechanics and foot strike. I also cued tucking his heel under his glutes on recovery, as he was prone to showing his studs to the sky. I gave him some homework to focus on, and on the next session he reduced his S-MAS from 6 on his left and 7 on the right to a 2 on both legs.
He ran a 5.33s 40-metre with “poor” technique, and a 5.44s 40-metre with “good” technique. I told him beforehand that I didn’t care about his time because I’d rather see him put into action what we spoke about.
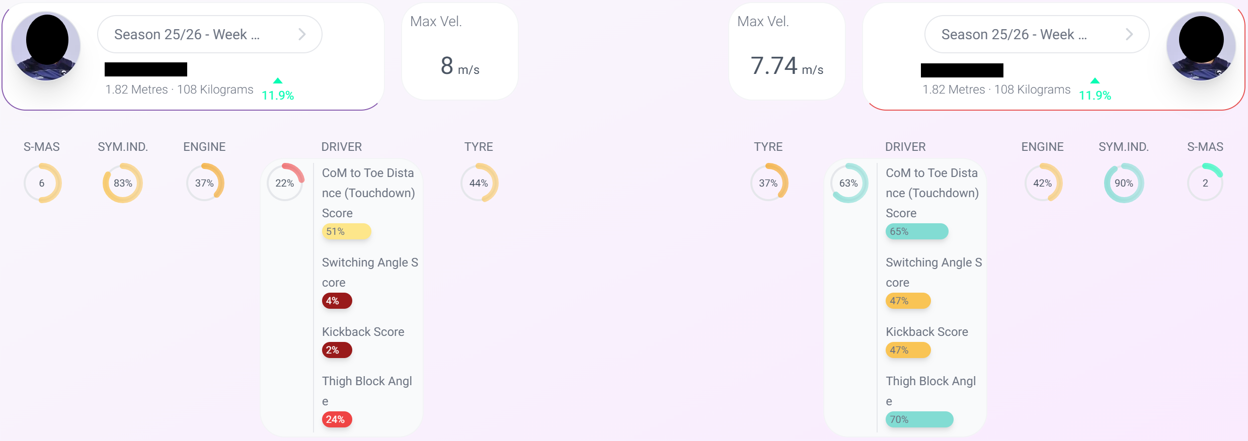
The analysis in Figure 12 shows how he improved his foot strike position by 14%, his switching angle score by 43%, his kickback score by 45%, and his thigh block angle by 46%. For a visual analysis, Figure 13 shows the touchdown and toe off kinograms. The pre-intervention run is in the top kinogram (athlete wearing blue), and the post-intervention run is in the bottom kinogram (athlete wearing red).
Yes, this is just one session, and it will take a conscious effort on everyone’s behalf to ensure the technical changes become engrained. Yet the ability to show the athlete that we are moving in the right direction helps massively in creating buy-in.
Forceteck is a video-based biomechanics system that allows practitioners to estimate how athletes move and the forces acting on their bodies using slow motion video capture (240 fps). Instead of relying on expensive lab-based motion capture, it uses slow motion video from consumer devices and augments it with biomechanical modelling to measure movement strategies and estimate ground reaction forces during acceleration and max velocity trials.
The key value in Forceteck’s SprintAI is that this analysis can be done in 30 minutes across a squad of 20–30 players. Coaches can monitor and evaluate sprint mechanics, spatiotemporal variables, and changes over time within real training environments. Did that cue work? Is this athlete improving? This makes it useful not just for performance analysis, but also for tracking rehabilitation progress, comparing players, and understanding how movement strategies influence mechanical stress on the body.
This objective feedback can reinforce or challenge what we think we see. It sharpens the coach’s eye, while simplifying complex mechanics into actionable interventions.
Tweet ThisIt will take a conscious effort on everyone’s behalf to ensure the technical changes become engrained. Yet the ability to show the athlete that we are moving in the right direction, using the S-MAS, helps massively in creating buy-in.
@jonobward