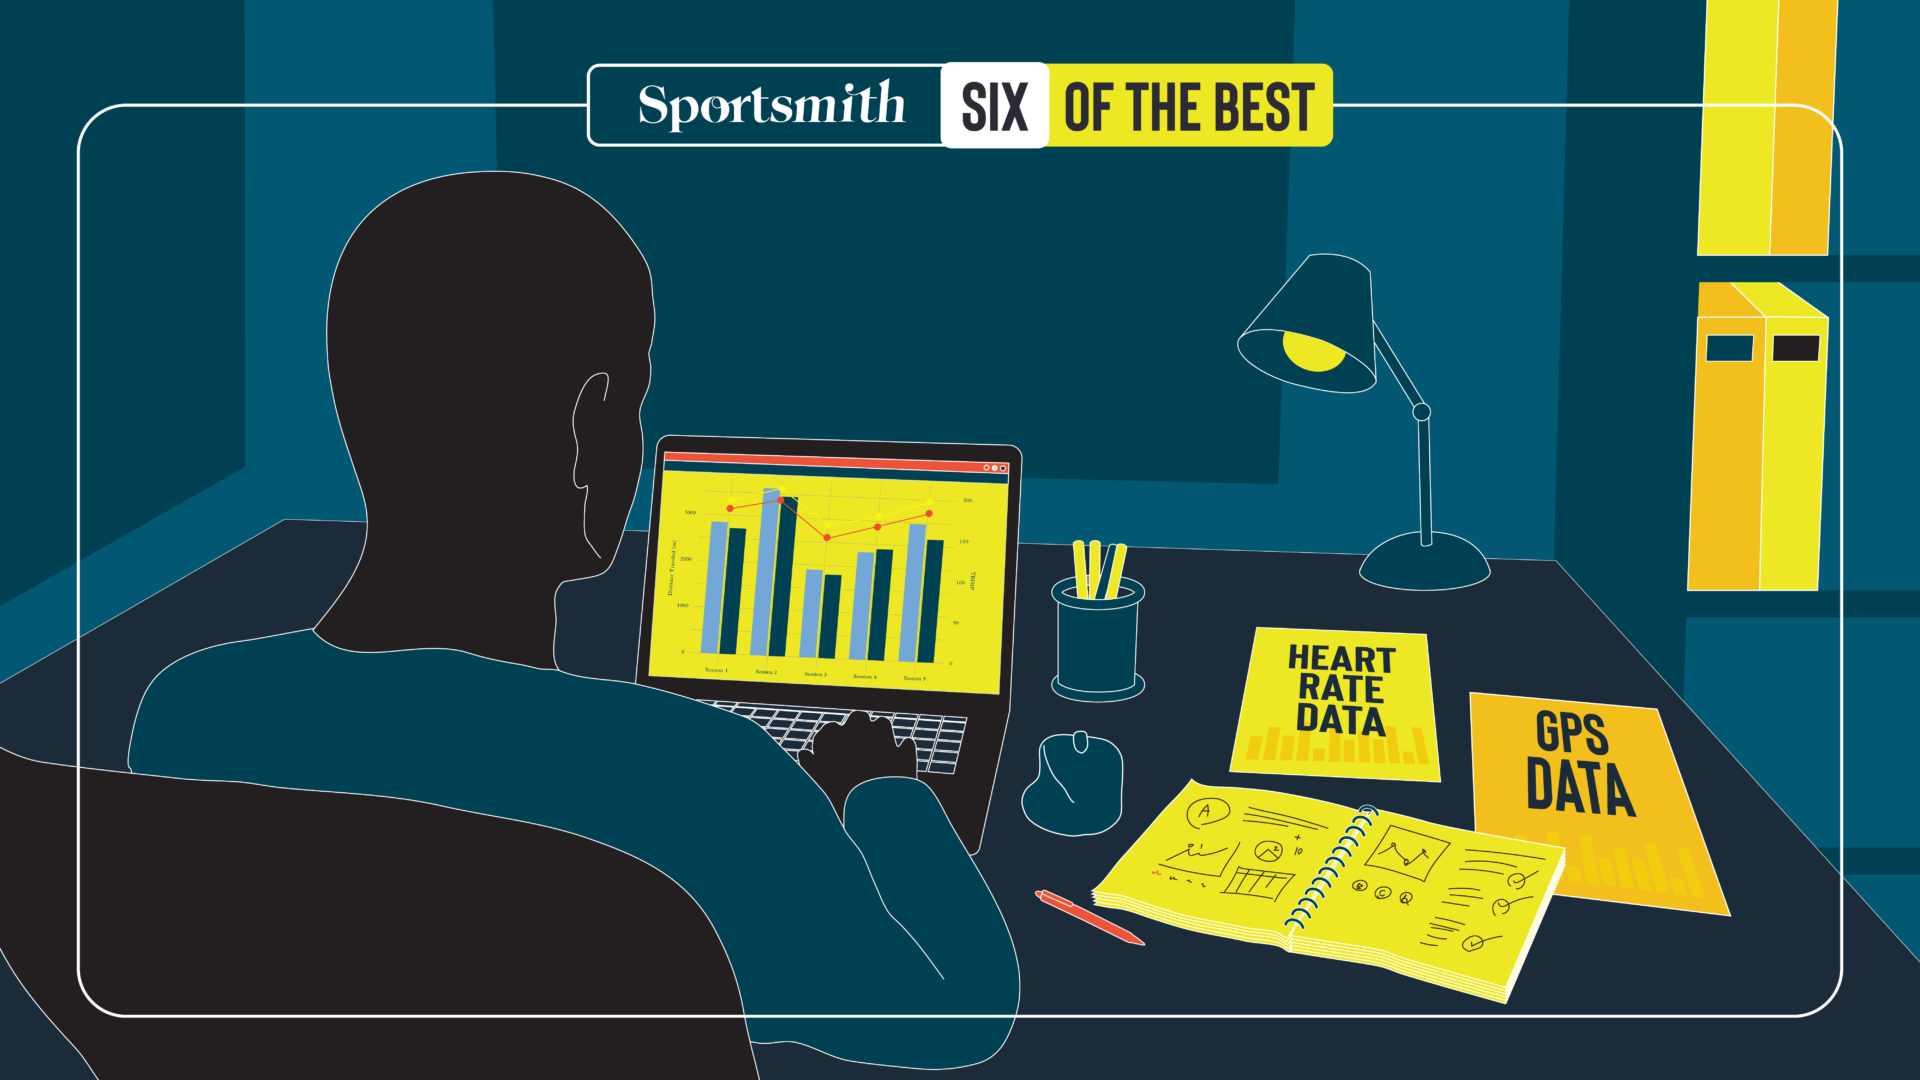
Six experts at the forefront of tracking data were asked this question. These were their answers:

Clive Brewer
Director of Olympic Strength & Conditioning, University of Notre Dame
This is an insightful question. Data that we collect which either isn’t actionable or impactful to our decision-making, is a waste of time for our athletes. More importantly, it reflects our credibility as practitioners whom they trust with their welfare.
One of the variables that I have reduced reliance upon over time, other than as a “sense check,” is in-performance heart rate (HR). We do not even record it with our NCAA basketball players.
My view on the value of HR data for team sport athletes changed significantly with the advent of reliable athlete tracking systems.
Back in 2009, we first used GPS with England Rugby League. Being able to track the work that a player was doing (rather than the metabolic cost of that work) made me realize that I had probably been making bad decisions prior to this point when my only measure of training volume load was HR.
Consider that I was monitoring live the HR of every player in a team. On “work capacity days,” if a player had spent an appropriate amount of time in the “red training zone,” I would deem them to have done enough work. We would prescribe additional training for players who hadn’t.
Logically, the fitter the athlete, the less cardiovascularly demanding a given work intensity becomes. Therefore, it is highly probable that I was rewarding less fit athletes with less work and punishing those with a higher capacity with additional training – therefore exacerbating the gap in fitness potential!
With the advent of being able to track the work done, I realized that as long as a player was able to undertake the appropriate work, the immediate cost of that work became far less relevant. Heart rate data became a secondary factor of analysis.
For example, if we saw a change in players’ ratio of speed exertion to dynamic stress load in real time, our next reference data was HR data. This would tell us if this was possibly a fatigue response.
If HR data wasn’t outside of the normal range for the amount of work done, our next line of thought was: “Is this because of a change in physio-mechanical loading?” Which is, is the player compensating around a potential musculoskeletal issue that would require discussion with the player?
With our desire to optimize efficiency for athletes, we now have to decide what monitoring is worth the effort and investment. For example, our athlete tracking harnesses can either have a built-in HR monitor, or we choose a different harness (and therefore size of unit) with a greater sensitivity to high-frequency movements (velocity change, direction change, impacts) in an indoor setting. We could invest in supporting technology to integrate HR data, but this has additional resource implications and equipment for the athlete to wear.
Given these trade-offs, I will happily not record HR data, in order to gain data that really informs my analysis of the training and subsequent load planning at an individual level.
Tweet ThisGiven these trade-offs, I will happily not record HR data, in order to gain data that really informs my analysis of the training and subsequent load planning at an individual level.
@Clivesportsandc

Eric Rash
Director of Applied Performance, Baylor University
There are tests that make complete sense in theory but fall apart the moment you try to scale them. Nordic hamstring testing was that for us, and the reason we stopped had nothing to do with the test itself.
We stopped using the NordBord for roster-wide monitoring because we couldn’t consistently collect enough data to make it meaningful. Inconsistent data from a good test is still bad data.
The NordBord is a legitimate tool. The research behind eccentric hamstring strength and injury risk is well established, and the metrics it produces are valid. When we began collecting with our football program in January 2023, the intent was sound. Build a hamstring strength profile across the roster, track it over time, and use it to inform training and return-to-play decisions.
The reality of doing that with 120-plus athletes and a single unit looked very different.
Each session took 25-30 minutes to work through a group. Scaled across an entire roster, with position-group scheduling, practice obligations, and other off-field commitments competing for the same time windows, consistent collection became almost impossible. We’d get a solid block of testing, then lose weeks before we could test again.
That’s the hidden cost of a logistically demanding test: it doesn’t just slow you down, it creates large gaps in your data. Longitudinal monitoring only works when data points are comparable. When gaps appear, you stop tracking change and start collecting disconnected snapshots that are difficult to act on.
Staff turnover at the end of the spring season accelerated the decline. In the transition, the planning and coordination required to execute testing at scale quietly fell out of priority. Without someone owning the process, it didn’t survive the off-season.
We still use the NordBord, just differently. In return-to-play scenarios with a smaller, targeted group of athletes, paired with joint-specific isometric testing, it earns its place.
Smaller numbers, clear clinical purpose, dedicated oversight. That’s an environment where you can control the conditions well enough for the data to mean something.
The lesson wasn’t about the test. It was about the infrastructure required to make a test useful.
Good data requires consistent collection, and consistent collection requires systems that can survive staff changes, schedule pressure, and the daily demands of a Power 4 program. When those systems aren’t in place, even a valid test stops being valuable.
Tweet ThisThe hidden cost of a logistically demanding test like Nordic hamstring testing: it doesn’t just slow you down, it creates large gaps in your data. Longitudinal monitoring only works when data points are comparable.
@EricRashWTD

John Griffin
Director Player Performance, Atlanta Falcons
The one metric we stopped tracking closely is maximal strength numbers in the weight room. Specifically, 1RM or estimated max loads for key lifts.
Over years of working with teams, a clear pattern emerged: the strongest athletes on certain movements rarely correlated with the most effective or dominant players on the field. The guy who squatted the most or benched the highest didn’t automatically translate to better game performance. Once we established a requisite baseline of strength—a level we deemed sufficient for the demands of the sport and position—we found that pushing for higher and higher maxes didn’t meaningfully change training decisions.
For an athlete hitting the top percentile in a lift, programming stayed largely the same as the group. We shifted individualization toward anatomy (lever lengths, joint angles), positional strategy, current physical status (age, training age, injury history), or movement quality rather than raw load progression.
Chasing ever-increasing numbers often became a distraction, pulling focus toward arbitrary job duties of “driving numbers up” instead of what actually mattered.
Stepping away from that obsession freed up significant time and mental energy. It allowed deeper emphasis on movement expression—how force is applied in context, rate of force development in sport-specific patterns, repeatability under fatigue, and transfer to the field.
The foundation of a truly adaptive training environment is one that prioritizes improving athletic capacity across multiple qualities, not just raw strength.
This shift hasn’t meant abandoning strength work; it means using it as a tool rather than the endpoint. Athletes still get stronger, but the process feels more purposeful and less enslaved to the barbell.
In the end, performance in practice and on game day—not a leaderboard in the gym—drives the decisions.
Tweet ThisThe one metric we stopped tracking closely is maximal strength numbers in the weight room. Specifically, 1RM or estimated max loads for key lifts. The strongest athletes on certain movements rarely correlated with effectiveness on the field.
@_CoachGriffin

Chris Bailey
Senior Analyst in Performance Science, Minnesota Twins
This response may not be expected coming from me since I’ve done a decent amount of public work in this area, but strength asymmetry / imbalance is not something I put value in tracking anymore.
At its core, strength asymmetry is just a potential signal of weakness. In a predominantly unilateral sport like baseball, it may just be a byproduct of being successful at that sport for a long time.
Unilateral weakness that is below a necessary threshold may be of concern, but the asymmetry magnitude isn’t necessarily concerning if the athlete satisfies that threshold.
We’ve also seen in public research that both unilateral and bilateral training are successful at decreasing asymmetries, and training doesn’t necessarily need to target the weaker limb specifically. Regarding bilateral training, the athletes often get stronger by the weaker limb catching up—the rate of strength increase does not have to be symmetrical.
There are quite a few issues with strength asymmetry research, interpretation, and application. Reliability is a big question, and if we can’t assume the data are reliable, we can’t assume validity as a result. Asymmetry appears to be task-specific, so we can’t simply say an athlete is “left side dominant,” because that may only be true for the specific task and variable we are looking at.
Concerning application, a lot of the technology we have available to us produces asymmetry scores, but they use different equations to quantify it. This means we may expect values produced by company A to be larger than those by company B, even if they start with the same data.
The potential connection between asymmetry and injury is likely what keeps this topic around, and it simply isn’t backed by sound research. There may be some connection with performance detriments in certain sport tasks, but much of this fails in replication. My first-ever publication showed one, but I failed to reproduce the effect later when I increased the sample size.
There’s also the question of how much is too much, and a 10% value is often mentioned. Unfortunately, the main source for this is a quadriceps-to-hamstring strength ratio paper, not bilateral strength asymmetry. If there is a true threshold connected to injury or performance, it is likely specific to your sample and sport, so it can’t be universally applied.
Tweet ThisStrength asymmetry is not something I put value in tracking anymore. Strength asymmetry is just a potential signal of weakness. In a predominantly unilateral sport like baseball, it may just be a byproduct of being successful at that sport.
@cbaileyphd

Zach Higginbotham
Director of Sports Science, (Formerly) University of Michigan
“Averages are for audiences, not decisions.”
I stopped using absolute team and positional averages as decision-making tools. Not because the data was wrong, but because it was never telling the story accurately enough. Once I understood why, I couldn’t unsee it.
Working in American football, most coaching staffs default to team averages, positional norms, and broad summary metrics to tell a single, concise story. I get it. The mental load in a high-urgency sporting environment is enormous, and mental shortcuts feel necessary. But when a single number is meant to represent a group of athletes whose demands, histories, and tolerances vary wildly, it stops being a signal. It becomes noise dressed up as clarity.
The clearest example: player load.
On paper, it’s a graceful formulation. It calculates cumulative mechanical load between two points, accounting for everything that happened in between. Useful, right?
Except when I applied it at the group level, I found myself comparing starting wide receivers against developmental receivers in the same GD-2 practice. Same position. Completely different demands. The metric looked identical, the reality wasn’t. Once I separated them into individual reporting buckets and started comparing athletes against their own maximum tolerable doses and specific group rolling averages, the number finally told me something I could act on.
The broader lesson wasn’t about player load specifically. It was about who the summary is really for. Wholesale reporting structures, positional averages, catch-all metrics: those exist to give stakeholders a digestible story. That’s legitimate. I realized when my own decision-making occurred, it had done so via the same framework utilized when reporting to the head coach in the morning briefing. Resultantly, my technical delivery stalled.
Cognitive offloading is intended for the stakeholder, not the sports scientist. The moment I separated those two jobs and stopped letting group-level summaries tell the story of the individual, my reporting improved, my communication with coaches improved, and the data finally started to change how we operated.
Tweet ThisOnce I separated them into individual reporting buckets and started comparing athletes against their own maximum tolerable doses and specific group rolling averages, the number finally told me something I could act on.
@CoachZach32

Fran Silver
Data and Performance Lead, Arsenal Women FC
This sounds like it should be a simple question. With the abundance of things we can measure in sports performance, you’d think it would be easy to point to something I tried, tested, and discarded.
But the question sticks, because it rests on a flawed assumption: that a measure’s value is defined by how often it forces you to act.
In sports performance, that’s not the way I choose to think about the data I collect. A measurement’s value lies in how it supports, refutes, or refines the many hypotheses I encounter daily.
When pondering the question, I realized something important: I’ve never abandoned a measure for that reason. Lots of measures don’t lead to a decision change. But their value is embedded in context, confirmation, trend tracking, or anchoring what “normal” looks like. In this sense, their stability is the signal.
Decision-making in football isn’t uniform. Indeed, there are moments where a single measure is enough. But there are just as many situations where a measure is only meaningful when aligned with wider context: the game model, the schedule, the player’s history, the tactical plan, the medical picture. Decisions typically aren’t made easily, and the honest answer to questions is often “it depends.”
The reasons I’ve stopped tracking something are more practical ones. Sometimes the issue is validity or reliability. Sometimes it’s physiological rationale. Sometimes it’s simply workflow friction, as with RPE, the first measure I thought of when thinking about this question. The measure didn’t fail, but the collection method did. I stopped tracking it because it became too onerous to continue doing so.
The Black Swan logic really resonates here. A measure may not yet have affected my decision-making because the moment is yet to come. Moving on from a measure because it hasn’t yet changed a decision assumes I understand its full meaning in the most absolute way — but I don’t, and I’d be arrogant to think I ever will. Frankly, I just haven’t encountered the moment when it might matter.
This leaves me with an honest conclusion: I’m not sure I can name a measure I’ve discarded because it was incapable of informing decisions. I still believe (perhaps naively, perhaps optimistically) that most have at least some potential to matter in the right contexts. That possibility alone is reason enough to keep them.
Tweet ThisSometimes it’s simply workflow friction, as with RPE, the first measure I thought of when thinking about this question. The measure didn’t fail, but the collection method did. I stopped tracking it because it became too onerous to continue doing so.
@mrfransilver