Developing young talent is paramount to the success of any team. The challenges are always how to objectify the improvement over time and create key performance indicators that assist in the delivery of services across coaching, sports science and sports medicine teams.
There are many methods for attacking player development, from grading systems to timelines. But all of these can be cumbersome, time consuming and, eventually, fall by the wayside as the rigors of team sport life take over. Covid-19 has impacted us all, and team sport has certainly not been immune to its consequences, with decreasing staff sizes and budgets making time-efficient application crucial for any program.
For objective, developmentally-oriented reporting to be successful, you first need to establish key performance indicators around these three attributes:
- Measures that are easily reproducible and scalable: can you reproduce and present this for multiple athletes efficiently?
- Information can be collected at specific intervals throughout the year, irrespective of competition and calendar interruptions.
- Data that is specific to the goals, trajectory and aspirations that the athlete and club each have for the athlete.
The information needs to feed across all areas of the athlete’s footprint, from coaching to nutrition. The organization’s goal should be to gather specific information that the entire staff can easily interpret and put to use. Ideally, you want to limit the impact on the athlete by finding evaluations that you can within normal training or that the staff can monitor without any additional action by the athlete.
Tweet ThisWe want to limit the impact on the athlete by finding evaluations that you can do within normal training or that the staff can monitor without any additional action by the athlete
@jimmyhanisch
It is a fine balance with player development analysis. If there’s not enough detail, you will lack the information necessary to provide individualized action. But too much detail hinders the process by over-complicating it, decreasing the ability to scale across the entire team and adding too much to everyone’s workload.
Think of the “Rule of Three”
I believe we can approach harmony simply by adopting the rule of three. A Latin saying, omne trium perfectum, literally translates to “everything that comes in threes is perfect.” We can break down an athlete’s pathway into three key areas: practice / training development, performance development and off-field development.
Each of these areas has a focus that directly impacts what they produce on the field, court or pitch; how they are physically improving through performance metrics; and how they take care of business outside of the training facility (a fantastic measure for their level of commitment or to quantify why they want to be an elite athlete).
This style of reporting is used to assist in articulating whether your current program, coaching and curriculum are showing improvement in the areas that you have deemed as important for a successful athlete within you program. Practitioners should limit themselves to a maximum of three metrics per area. You can become amazingly complex with one category if you track it over time.
How it could work: College football running back
The sports performance team will need to iron out a few details, such as the timeline for analysis, whether the testing will be performed all year, the testing intervals (weekly, monthly, quarterly) and who is responsible for which sections of reporting. The process must be well-defined and agreed upon by all involved via thorough, robust communication. For this example, the timeline is the start of fall camp to the end of the season. Assessments are completed every four weeks over this five month span.
Practice / training development
This student-athlete had fumble issues in his last year of high school football. The goal, then, is to limit the number of fumbles he commits so the coaches can assess his true potential as a starter for his team. The longitudinal objective measures are:
- Number of fumbles per carry in practice
- Number of fumbles per carry in games
- Type of fumble (forced error or unforced error)
There are multiple ways to analyze and display this information. Keep in mind the data ingestion preferences of the key decision makers.
| Practice | #Fumbles / #Carries | #Fumbles | #Carries | Game | #Fumbles / # Carries | #Fumbles | #Carries | Forced error | Unforced error | |
| Fall camp | 2.2% | 6 / 276 | 6 | 276 | N/A | 3 | 3 | |||
| Quarter 1 | 2,9% | 4 / 140 | 4 | 140 | 5.0% | 6 / 121 | 6 | 121 | 5 | 5 |
| Quarter 2 | 2.2% | 3 / 134 | 3 | 134 | 6.0% | 10 / 168 | 10 | 168 | 6 | 7 |
| Quarter 3 | 1.6% | 2 / 125 | 2 | 125 | 3.1% | 5 / 160 | 5 | 160 | 3 | 4 |
| Quater 4 | 1.3% | 2 / 160 | 2 | 160 | 1.2% | 2 / 165 | 2 | 165 | 3 | 1 |

Assembling this data requires watching film and counting the number of fumbles and carries in practice as well as in games. From the film review we can determine whether he fumbles more in practice than games, whether the ball is being forced out (which would indicate we should work on grip strength and ball handling technique) or whether it is an unforced error (in which case we need to coach the handoff process from quarterback to running back).
Keeping in mind this is a hypothetical, a brief description of the results could be a decrease in fumbles throughout the season to a rate of 1.2-1.3% fumbled carries in both practice and games. However, his unforced errors only declined in the final quarter of the year.
Now moving into the next season, we have benchmarks for this student-athlete to maintain and goals to set about future progression as well as key coaching cues we can use on the field for these attributes.
Performance development
The goal for this stage is developing raw strength in the context of push after contact.
Force plate technology and performance software such as Hawkin Dynamics enable us to quantify the following performance output over time:
- Countermovement jump test: Average braking force (Newtons): The ability of the athlete to create force and load their body before propulsion.
- Countermovement jump test: Peak propulsive power (Watts): The maximal force that an athlete can produce as quickly as possible, which is a great measure for explosiveness.
- Isometric mid-thigh pull: Peak force (Newtons): This indicates the peak force this player can produce, and translates well to the field. When under pressure during a run play, a running back is tackled and needs to produce force under load to burst through the tackle or push for those extra 1-2 yards after contact.
Graphs are the best option for displaying this to the coaching staff, sports science and sports medicine teams and athletes.


From the data we can see incremental improvements in both force and power across all three metrics. This not only builds confidence in the current performance improvement program but also in the athlete’s diligence in adhering to the strength & conditioning programming. This process also sets specific benchmarks for next season as well as targets for reporting to the preseason training. For instance, you could aim to return from the off-season at 80% of the player’s maximum from the preceding year.
There is a litany of applications for force plate performance data to benchmark, profile and longitudinally express over an athlete’s career. Importantly, you can be extremely specific on which metrics to use and what you believe are important indicators for success. These metrics can be used at any sport level, position within those sports or within your training and rehabilitation setting.
For example:
Baseball or cricket: Isometric shoulder peak force using I’s, Y’s and T’s testing to target shoulder strength improvement or monitor shoulder health over a season. A goal may be to show consistency throughout the season without any decay in shoulder strength.
Australian Football or rugby: Tracking an athlete’s dynamic strength index over time to understand the fluctuations in an athlete’s training and decipher whether an athlete may require maximal strength training, explosive / plyometric training or concurrent training across a season. The goal could be to maintain balance of strength and explosiveness through phases of the year.
Football, basketball, netball, tennis, squash: Braking rate of force development is a great tool for identifying the speed at which athletes can develop force then apply it – think cutting quickly to change direction. A goal may be to build single leg RFD across the season and find balance between left and right limbs.
Tweet ThisBraking rate of force development is a great tool for identifying the speed at which athletes can develop force then apply it – think cutting quickly to change direction
@Jimmyhanisch
Return to Play: Alternatively, if you have one of your young athletes in long-term rehabilitation you can use force plate data as part of their progression, identifying performance metrics, separating left and right, and highlighting improvements in upper or lower body asymmetry. Some examples could be an isometric hamstring test identifying peak force in each limb at different ranges, calculating peak force in plyometric push-ups for pectoral strain injuries or peak landing force for a single leg countermovement jump test for lower limb injuries. These would all come under the Performance Development category within the structure we laid out.
Off-field development
Nutrition goals are a useful example of off-field performance outside of the organization. Weight gain / loss / maintenance or improvements in body composition are common metrics. However, we can adopt any behavior or attribute with a nexus to athlete development. In our story, this player has a tendency to be late to meetings and to class. We can use punctuality, then, as a marker for his success in being diligent away from the facility.
The coaching and performance staff can craft ways to monitor the athlete’s ability to make appointments on time. Discuss these with key stakeholders: medical, S&C staff, coaches and instructors and professors. When this athlete is late or has missed an appointment (or, worse, a class), the appropriate staff member is notified and notes it in the athlete’s folder.
For assessment purposes we can categorize the elements in his schedule as:
- Coaching: Meetings, film review, practice
- Medical: Treatment, physiotherapy, doctor appointments
- S&C: Lifting sessions, recovery sessions
- Academic: Lectures, study groups, office hours
| Coaching | Medical | S&C | Class | Total | |
| Fall camp | 4 | 1 | 3 | 6 | 14 |
| Quarter 1 | 1 | 2 | 2 | 3 | 8 |
| Quarter 2 | 2 | 1 | 2 | 4 | 9 |
| Quarter 3 | 1 | 1 | 2 | 3 | 7 |
| Quarter 4 | 0 | 1 | 2 | 4 | 7 |
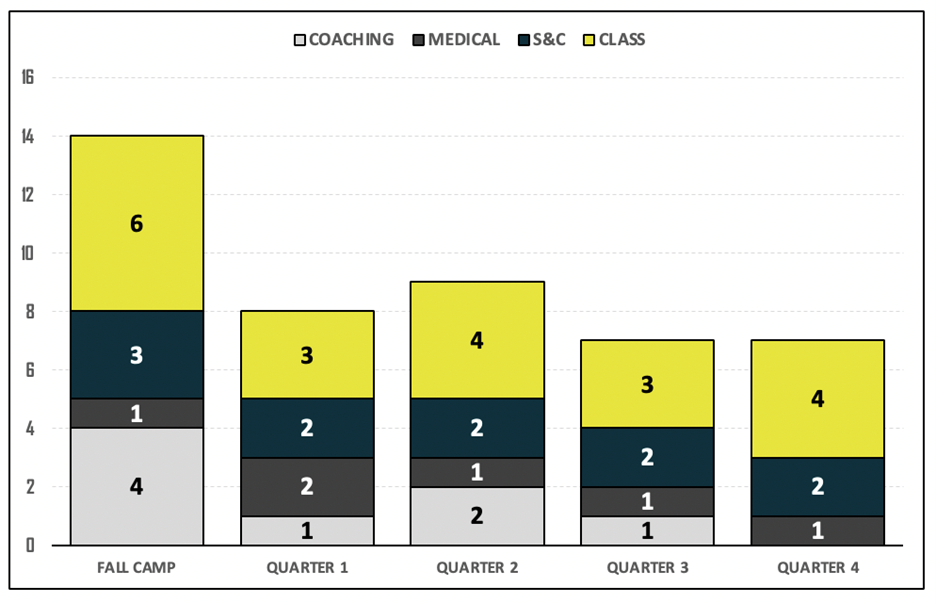
Understanding the context is obviously important. The data shows the academic bucket suffers the most missed appointments. Perhaps the reason for the big spikes were due to the start of fall camp, which coincides with the start of the school year, an obviously stressful time. Final exams for the semesters, meanwhile, occur in quarters 2 and 4 . Appreciating this context enables the staff to have clear discussions with the student-athlete about his goals for starting next year and how to best manage his time moving forward.
There are practical options here, as well, that we can go into more detail about with the student-athlete, such as sleep routines and setting calendar alarms to keep him on track.
Key roles in the player development process
Director of player development
Assign who will be responsible for coordinating the process from start to finish. This includes discussing each athlete’s key performance indicators with the relevant departments and writing up the final report, while developing the action items and future goals. Ideally, this person has a relationship with all departments: coaching, player engagement, sports science and sports medicine, plus academics.
This certainly does not need to be a full-time role, but should be given to someone with excellent communication and relationship acumen.
Department coordinator
Identify a staff member within each department who can manage the timelines, data and analysis for each athlete. This may differ in the coaching area, where a specific position coach may be used for each athlete depending on how much on-field analysis is required.
Player development team
Establish a meeting and invite all department coordinators to attend. If your feedback loop is once every quarter, meet at the start of the quarter to identify key performance indicators, practical application of data collection, timing strategies and overall feedback from past reporting. Then meet every three weeks to track performance and discuss any ongoing issues that could influence the progression of reporting, e.g., injuries or off-field circumstances.
Meeting every three weeks is an important rhythm, as it allots time prior to the end of the quarter to tidy up testing, accumulate data, write reports and send out drafts for review.
This table highlights the impact on staff and the hours they will need to put forth to assist in the player development process.
| Staff | Number of athletes | Analysis required | Time required |
| Director of nutrition | 4 | Athlete 1: Body composition Athlete 2: Body composition Athlete 7: Adherence to nutritional plan Athlete 9: Body weight maintenance Final report | 10 minutes per athlete per month Final athlete total time: 30 minutes per athlete |
| Position coach | 2 | Athlete 2: Objectify skill development (count success rate) with help from performance analysis Athlete 7: Arrives to meetings on time Final report | 15 minute per week for Athlete 2 5 minutes per week for Athlete 7 Final report total time: 15 minutes per athlete |
Overall, for this quarter the Director of Nutrition will spend a total of two hours and the Position Coach will spend four and a half hours . Obviously, you could provide assistance where applicable, such as sending a performance analyst to assist the Position Coach’s timeline.

Individual athlete management is a team endeavor
There is a plethora of directions you can take with player development, so this article can only guide you towards some ideas for assessing your own practices and trying new things. By keeping the philosophy simple, and being methodical and deliberate with specific fundamental data, you can formulate detailed and individualized programs for your athletes.
It takes a village to coordinate a successful player development program. If you find the right balance between simplification and individualization, this process can be a linchpin to a successful program. This process can accelerate your talent and build your athletes to become major contributors to your program’s success both on and off the field quicker, ultimately giving you a competitive advantage.