
Content of essentials article
- Introduction to GPS systems
- GPS and other athlete tracking technologies
- What can we gain by using GPS?
- Different levels of player tracking metrics
- Selecting GPS metrics for your sport: Lessons from ice hockey
- A closer look at intensity
- Disseminating your GPS data
Introduction to GPS systems
Global positioning system (GPS) data enables sports science practitioners to quantify their athletes’ movement demands and external training loads across training and competition. This information enhances the planning and monitoring processes of all the stakeholders involved with an athlete or team.
This article will introduce the essential GPS metrics and the critical process of selecting and disseminating the most suitable metrics for your sport.
GPS and other athlete tracking technologies
The term “GPS” is sometimes used over-broadly for athlete tracking technologies. Not all technologies utilise GPS – these other devices can house a number of different technologies. Therefore, it is important to first understand the differences between and the advantages and disadvantages of each.
The most common “sibling technology” for GPS are inertial measurement units (IMU). These can be standalone devices, but many products contain both a GPS unit and an IMU.
The IMU typically consists of an accelerometer, gyroscope, and magnetometer. The accelerometer is most commonly a piezo-electrical tri-axial accelerometer. This sensor quantifies acceleration in G-force (1 G = 9.81 m/s/s) across all three planes – hence, “tri-axial.” Gyroscopes use gravity to determine angular velocity, detecting tilt and rotation of the device. The magnetometer measures the orientation with the Earth using the magnetic pull of true north.
The IMU’s output combines data from these three sensors. Because none of these sensors require a connection to a satellite, they work indoors, which can make them valuable and a better option than GPS for some applications.
Beyond GPS and IMU devices, optical tracking (OT), local positioning systems (LPS) that can include radio frequency information (RFID) or ultra-wideband (UWB), and light detection and ranging (LiDAR) technologies also exist. Although this article focuses on metrics derived from GPS and IMU, much of the discussion relates to analysis of data from these systems as well.
Tweet ThisThe term “GPS” is often overused for athlete tracking technologies, though not all use GPS. These devices may employ various technologies, so it is crucial to understand their differences, advantages, and disadvantages
@joclubbsportsci
What can we gain by using GPS?
Before we get into the selection of GPS metrics for our setting, we should start with the end in mind. In this case, we need to think about the roles that this data can serve. In our narrative review, we described three overarching purposes of tracking data: describing, planning, monitoring.
These functions overlap. For instance, describing training and competition movement demand helps plan training, as the coach or practitioner now has an empirical understanding of the expected demands on the athlete. If we understand the typical high speed running demands for a specific athlete in a game, we can plan their training with a view to preparing them to meet these demands.
Meanwhile, planning and monitoring processes overlap when we compare the outcomes of a training session or drill to what we intended or expected.
When GPS data has been collected and categorised appropriately over time, practitioners can develop a drill database to estimate the outcomes, in terms of both volume and intensity, for different drills. For example, we can objectively understand the difference in running load in a 5v5 small sided game carried out on a 40 yd x 30 yd pitch compared to one that is 30 m x 15 m.
Tweet ThisConsistently collected and categorized GPS data allows practitioners to build a drill database to estimate volume and intensity outcomes. For example, it enables objective comparisons of running load across games played on different pitch sizes
@joclubbsportsci

GPS data can help us explore an array of queries, such as different timeframes across which we may frame our analysis, including long term, season planning, day to day, and in session. Clearly, we need the ability to zoom in and out in order to address different purposes.
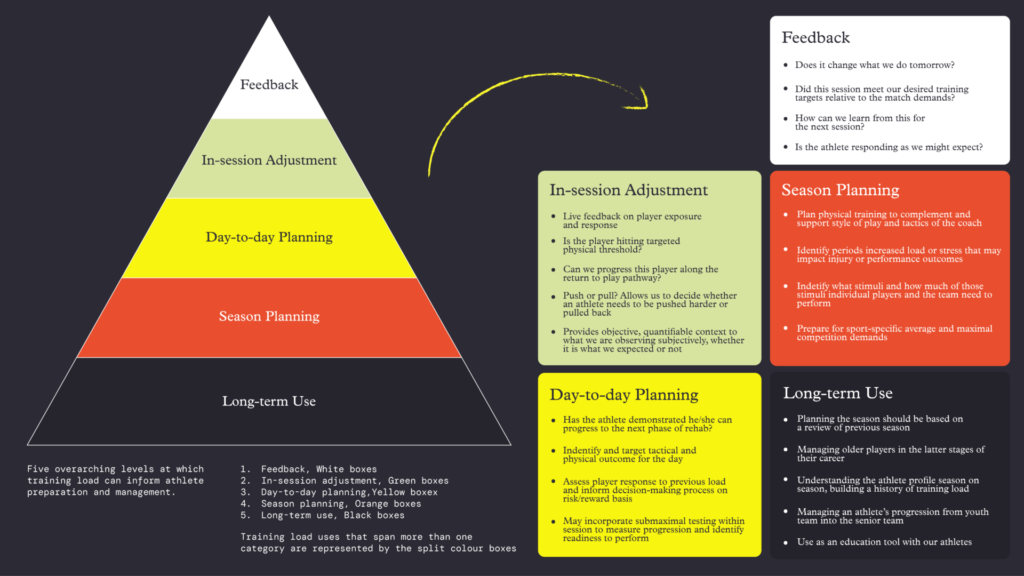
Notice in the figure a mixture of training and rehabilitation related purposes. Again, there is often overlap in these functions. The key focus remains describing the athlete’s demands in training and competition, using this information to plan their day / week / mesocycle (whether in training or rehab), and then reviewing their outcomes through monitoring.
I’ve selected five key purposes from the figure – one from each layer – that provide a starting point for a practitioner with GPS data, reinforcing the need to zoom in (i.e., on today) and zoom out (across a season).
Feedback: Does it change what we do tomorrow?
In session: Live feedback on player exposure and response.
Day to day: Identify and target physical outcomes for the day.
Season planning: Prepare for sport specific average and maximal competition demands.
Long term: Understand the athlete profile season-on-season, building a history of training load.
Tweet ThisGPS data can help us explore an array of queries, such as different timeframes across which we may frame our analysis, including long term, season planning, day to day, and in session. Clearly, we need the ability to zoom in and out
@joclubbsportsci
Different levels of player tracking metrics
The abundance of available metrics can be overwhelming. A straightforward framework for categorising these metrics can simplify the process.
Level 1 is the distances athletes cover in different velocity zones. Level 2 are events related to changes in velocity: acceleration, deceleration, change of direction. Level 3 are events derived from the IMU sensors commonly paired with GPS units.
If we think of the movement demands of common team sports, these levels make sense. Team sport athletes cover a notable amount of distance in their sport, often at different velocities. As such, total distance along with distances at different velocity zones (e.g., “high speed” and “sprinting” distance) are of interest from a training load perspective.
Given that our athletes are frequently changing their velocity, quantifying these changes in velocity is also meaningful. How much distance did the centre back have to cover while accelerating in this game? How frequently did a wide receiver have to decelerate in this practice session? How many changes of direction – and in which direction – does a netball centre have to make in a typical game?
Levels 1 and 2 describe an athlete’s velocity patterns in a given session. This, however, is limited to two dimensions: x and y. But sport, especially team sports, takes place in three dimensions. To better account for movements in 3D, including jumping and collisions, we can make use of the IMU-derived metrics from the wearable device.
Accelerometry derived load is a manufacturer specific metric, which sums the instantaneous rate of change from the individual vertical, medio-lateral and anterior-posterior planes. Essentially, this aggregates the “jerk” that the body experiences as a whole during the activity.
Other Level 3 measures include metrics relating to change of direction, collisions, and stride variables. Remember, these are derived from the inertial sensors. They relate to body movement, rather than location on the pitch as measured by GPS satellite data. IMU sensors also permit body part specific metrics from devices on the foot or arm, which provide ball striking and throwing measures, respectively.
The table below defines common metrics across each of these levels and illustrates some of the common measures for each.
| Level | Distance | Cumulative distance | Common Measures |
| 1 | Distance | Cumulative distance | Total and relative distances in speed/acceleration/deceleration zones |
| 2 | Acceleration (2D) | Instantaneous peak rate of positive change in velocity | Maximal, peak, or average distance / efforts / time in acceleration zones |
| Deceleration (2D) | Instantaneous peak rate of negative change in velocity | Maximal, peak, or average distance / efforts / time in deceleration zones | |
| Change of direction (2D) | Count and intensity of changes of direction derived from positional data | Total, percentage difference left vs. right, count in intensity zones | |
| 3 | Accelerometery derived load | Manufacturer-specific, modified vector magnitude of 3D acceleration values, expressed in arbitrary units | Total, relative to time, relative to distance, 2D (excludes vertical axis), 1D (absolute or relative contribution of individual axes) |
| Change of direction (3D) | Count and magnitude (g) of changes of direction derived from inertial sensors | Total, percentage left vs. right, count in intensity zones | |
| Impacts | Manufacturer specific metric that provides a count of 3D acceleration values (g) over a threshold | Count and magnitude of impacts | |
| Collisions / tackles | Accelerometery derived metrics split by left and right side | Count and magnitude of collisions | |
| Stride variables | Accelerometery derived metrics estimating ground contact time | Contact time, flying time, vertical stiffness (kN·m–1) | |
| Stride imbalances | Accelerometry derived metrics split by left and right side | Percentage left vs. right |
There are now also hybrid measures, such as metabolic power, which seeks to combine the actual cost of high speed (Level 1) and accelerated (Level 2) running [2].
| Level | Metric | Definition | Common Measures |
| Hybrid | Speed | Instantaneous peak rate of position change | Maximal, peak, average |
| Sport specific metrics | Specific machine learning algorithms designed to quantifying movement demands per sport | Quarterback throws, basketball court transition, ice hockey skating strides, rugby scrum detection, goalkeeper left vs. right dive count | |
| Metabolic power | Estimates the energetic demands of high intensity Level 1 and 2 actions via GPS or LPS data [3] | Metabolic energy (cal/kg), equivalentdDistance (distance covered running at constant speed on flat terrain, for a given energy expenditure), total metabolic power (ml/kg/min), distance / efforts / time in metabolic power bands |
Tweet ThisGPS data can help us explore an array of queries, such as different timeframes across which we may frame our analysis, including long term, season planning, day to day, and in session. Clearly, we need the ability to zoom in and out
@joclubbsportsci
Selecting GPS metrics for your sport: Lessons from ice hockey
Let’s start by thinking about the demands of your sport. Consider the following key factors:
- Playing surface: What type of surface is the sport played on?
- Playing area: What is the size of the playing field, and how much space does each athlete have?
- Game structure: Over what duration and intervals is the game played?
- Critical movements: What are the key movements that define game-changing moments?
When I began working for the Buffalo Sabres in the National Hockey League, I was struck (probably overwhelmed!) by the challenges of ice hockey – not least because the game is played on ice! Could my knowledge from land based sports be directly applied? Could I use the same tracking metrics?
Some translate, some don’t. This is why I’ve often described sports science practitioner as translators. Just because a particular metric is common in one sport doesn’t mean it’s relevant in another. Consider distance covered by a soccer goalkeeper, maximum sprints by a basketball player, jumps by an ice hockey player, and a sprinter’s decelerations.
These are all valid and critical metrics in some sports, but arguably not the most significant within each specific context.
Injury patterns often mirror the demands of a sport. In ice hockey, for example, hip and groin injuries are prevalent. Therefore, it’s essential to focus on metrics that provide insight into the demands of skating.
Can we quantify the load skating places on the body, despite the limitations of using an upper body mounted device? Can we track this load alongside readiness monitoring to identify when athletes might be at risk of overload? Additionally, athletes with a history of hip or groin injuries should be monitored more closely, as previous injury is the strongest predictor of future injury. Sports scientists should analyse GPS data and load monitoring within the context of an athlete’s injury history.
Level 1 measures
Hockey is played indoors, so we need alternatives to GPS as our tracking system to determine position. While distance covered is a global indicator of work, in hockey, some of this distance is covered through gliding rather than active skating. Can we differentiate the two?
We are also interested in high speed measures, but do appropriate velocity thresholds exist for ice skating as opposed to running? These were my priorities from a Level 1 perspective.
Level 2 measures
Ice hockey is characterised by rapid changes in velocity, making Level 2 metrics like acceleration, deceleration, and change of direction highly relevant – if the technology is sufficiently valid and reliable in an ice skating context. Again, we are faced with the challenge of determining appropriate thresholds for high intensity accelerations and decelerations. This is complicated enough in land sports, but what about on ice?
Level 3 measures
Some GPS vendors now offer skating specific metrics, such as skating symmetry. However, it’s important to question their reliability, especially since these metrics may be affected by the device being on the upper body. The issue is further compounded by the extensive equipment hockey players wear. Often, GPS devices are in pouches on shoulder pads rather than in custom vests beneath them. Understanding how this placement affects data outputs and the reliability of the collected data is crucial.
An additional factor to consider is the demand of shooting in ice hockey. Given the significant involvement of the upper body in shooting, these actions often register as large peaks in accelerometry derived load on GPS devices.
Tweet ThisA straightforward framework for categorising these metrics can simplify the process: Level 1 is the distances athletes cover in different velocity zones. Level 2 is events related to changes in velocity. Level 3 is derived from the IMU sensors
@joclubbsportsci
A closer look at intensity
One aspect of GPS metrics worth emphasising is intensity. So far we have focussed mainly on volume, such as the total distance, amount of high speed running, or the count of accelerations and decelerations. Yet intensity measures, such as total or high speed distances covered per minute, offer insights into the athletes’ exertion.
Intensity is important to understand how hard a drill or session is. Unsurprisingly, this is often of great interest to coaches. One survey study found coaches rated measures of “work rate / intensity” and “high intensity actions” as most valuable [4].
| Drill | PL/min | TD/min | HSR/min | SD/min | Acc/min | Dec/min |
| Conditioning | 12 | 120 | 70 | 20 | 1.2 | 0.3 |
| Match play | 10 | 105 | 15 | 1.0 | 0.7 | 0.8 |
| Possession | 7 | 70 | 5 | 0.0 | 0.7 | 0.9 |
| SSG: 3v3 | 9 | 100 | 15 | 1.1 | 1.3 | 1.5 |
| SSG: 6v6 | 9 | 90 | 12 | 0.5 | 0.9 | 1.0 |
| Technical | 8 | 75 | 5 | 0.0 | 1.4 | 0.2 |
| Transition | 4 | 80 | 25 | 8.0 | 0.8 | 0.8 |
SSG: small sided game, PL: PlayerLoadTM, TD: total distance, HSR: high speed running, SD: sprint distance, Acc: accelerations, Dec: decelerations, min: minute
Like with most things relating to training load, however, intensity is not straightforward. The table illustrates how different drills potentially overload different movement demands. For instance, a drill that is intense in terms of high speed running might not be as demanding when it comes to deceleration. Conversely, drills conducted in smaller spaces, such as small sided games, often place a higher load on velocity change demands like acceleration and deceleration. This highlights the importance of using a range of metrics across different levels to get a comprehensive understanding of both volume and intensity.
In sports with intermittent play, like basketball, ice hockey, and American football, measuring intensity on a per minute basis may be less meaningful due to frequent breaks and player rotations. However, intensity remains a crucial factor; it just requires a different approach to measurement. For these sports, analysing intensity by period or even by specific plays can provide more accurate insights. Advances in technology are making this level of analysis more accessible, with some systems now capable of integrating player substitutions and segmenting tracking data to analyse the demands of individual plays or periods. Quantifying the movement demands by specific plays in American football, for example, provides an integrated understanding of physical, technical, and tactical demands, which can also inform player specific rehabilitation drills when athletes are returning to play.
Tweet ThisIntensity is important to understand how hard a drill or session is. Unsurprisingly this is often of great interest to coaches. One survey study found coaches rated measures of “work rate / intensity” and “high intensity actions” as most valuable
@joclubbsportsci
Disseminating your GPS data
The final, yet critical, step in your GPS monitoring cycle is transforming raw data into meaningful information for key stakeholders. I use a hierarchical approach, in which the volume and complexity of the data are tailored to the needs of the audience. This aims to ensure that the right people get the right amount of information.
I combine this with a “Goldilocks strategy,” in which I strive to present a set of metrics that are “just right.” This means selecting the ideal amount of data for each stakeholder – not too much and not too little. The level of detail varies not only between different types of stakeholders but also within these groups. For example, a data driven coach with an understanding of sports science might appreciate more detailed analytics, while a coach less familiar or interested in numbers might prefer a simpler, more concise report. We should aim to present information in the format that each colleague prefers, whether that’s verbal, printed, via email, or via an online dashboard.
In the setting where I felt I had the most impact and job satisfaction, I actually shared less data with the head coach than with others I’d worked with. This was a reflection of the trust they placed in me. The coach didn’t need to see all the data or evidence; they trusted me to distil the information and communicate what was most important. This underscores the importance of tailoring your dissemination strategies to individual preferences.

The hierarchical approach in the figure aligns with the various purposes discussed earlier, and the West pyramid [7] highlights how different stakeholders focus on different levels of that pyramid.
As we’ve all experienced, coaches are primarily concerned with the immediate – how today’s data impacts tomorrow’s session. Therefore, any feedback to them should have a clear and obvious “so what” factor: What do they need to do about this data (if anything)?
On the other hand, management may be more interested in long term decision making. GPS data can help to answer questions about an athlete’s workload over time and the intensity they’re able to sustain. Such information can be a factor in decisions related to player recruitment and retention.
Performance staff, however, often need to keep both short term and long term perspectives in mind. This is where the “zoom” feature becomes essential: the ability to focus on today’s details while considering the broader implications over time. Ideally, our data dissemination systems should reflect this flexibility, offering interactive features that allow practitioners to adjust the timeframe of GPS data. They should be able to drill down into a player’s training load for today and smoothly zoom out to view chronic workload trends.
This ensures that data is not only accessible but also actionable, tailored to meet the diverse needs of all stakeholders involved.
Tweet ThisThe final yet critical step in your GPS monitoring cycle is transforming raw data into meaningful information for key stakeholders. I use a hierarchical approach in which the volume and complexity of the data are tailored to the needs of the audience
@joclubbsportsci