

Fatigue is a general lack of alertness and degradation in mental and physical performance. The US Federal Aviation Administration classifies fatigue as transient, cumulative or circadian.
Transient fatigue is acute fatigue brought on by extreme sleep restriction or extended awake hours over 1-2 days. Cumulative fatigue follows extreme sleep restriction over multiple days. Circadian fatigue results in reduced performance during nighttime hours, particularly during an individual’s “window of circadian low” (WOCL).
An athlete’s neuromuscular system is the interplay of the brain and spinal cord with articulating muscles, which controls body movements and functions. Alpha motor neurons transmit signals as action potentials from the brain and spinal cord to muscle, causing the muscles to contract and move. Neuromuscular outputs emerge from high threshold motor unit recruitment, rate coding, and the size principle.
Ultimately, the neuromuscular system determines an athlete’s ability to develop large amounts force in a short amount of time. These neuromuscular qualities are advantageous in athletics, with degrees of variance relative to the demands of the sporting activity.
Within aviation, fatigue can alter a pilot’s cognitive function and ability to operate aircraft properly. The gravity of these situations can be extremely dire. In athletic performance, neuromuscular fatigue can cause a decrease in outputs and blunt an athlete’s ability to perform at a high level.

Similar to fatigue in aviation, there are stages to neuromuscular fatigue within athletic performance. Fatigue is not a binary or black-and-white quality. It has many shades of gray. In fact, objective metrics can classify and delineate stages of neuromuscular fatigue. Therefore, it is vital for practitioners to identify the early onset of neuromuscular fatigue and create interventions based on these findings.
Velocity based training technologies and force platform analysis provide great standardized and repeatable measures of neuromuscular function and fatigue.
Tweet ThisFatigue is not a binary or black-and-white quality; it has many shades of gray. Monitoring the early onset of neuromuscular fatigue is vital for creating timely interventions
Adam Petway
Stage 1: Loss of refined motor control
The first stage of neuromuscular fatigue is the loss of refined motor control and coordination. This can manifest itself in several ways. For example, in horizontal jumps, an athlete that is typically on the board is way behind or in front the board, resulting in a foul.
In basketball, this first stage of neuromuscular fatigue shows up in the technical skill of shooting. One example is an athlete who is typically a high percentage free throw shooter suddenly missing short.
Another way we can understand the first stage of fatigue in shooting a basketball is by examining the sequencing of joint actions of a jump shot. If an athlete typically sequences their joints in a congruent manner where their ankle, knee, hips, and trunk are moving at similar times and velocities, and then shifts to a strategy where they segment their joint actions to raise the hip or trunk early compared to the ankle and knee, they may be at the acute onset of neuromuscular fatigue. These changes may be transient and only occur for one or two training sessions. Also, in both cases, outputs will not be affected, but performance may decrease based on the skills associated with the loss of refined motor control and coordination.
In the gym, an athlete may move a certain load maintaining a prescribed velocity during this stage of fatigue without the coach noticing. If that happens, the first stage of neuromuscular fatigue goes unchecked.
However, we typically look at the path of the bar as an indicator of this first stage of fatigue rather than bar velocity. For example, in an exercise like the squat, dead lift, or bench press, the path of the bar should be primarily vertical. Any excessive anterior-posterior sway may indicate the acute onset of neuromuscular fatigue, even though power output and velocity were not compromised within the movement.

For force platform analysis, we perform a high frequency 5-hop test to examine these early onsets of neuromuscular fatigue. If the athlete is inconsistent where they land on the plate in this test, and lack coordination and rhythm, they may be “early fatiguers.” More broadly, sway and center of pressure can be low hanging fruit to identify this first stage of fatigue based on refined motor coordination in single leg balance.


Typically, if an athlete is presenting in these early stages, it is not a cause for major alarm. We may adjust their densities of training, volume of programming, or just simply train through, depending on the time of year and the effects this has on performance. Outputs are not compromised in either example shown. Therefore, if practitioners only look at absolute metrics like peak values, they may be too late to intervene in the early stages of neuromuscular fatigue.
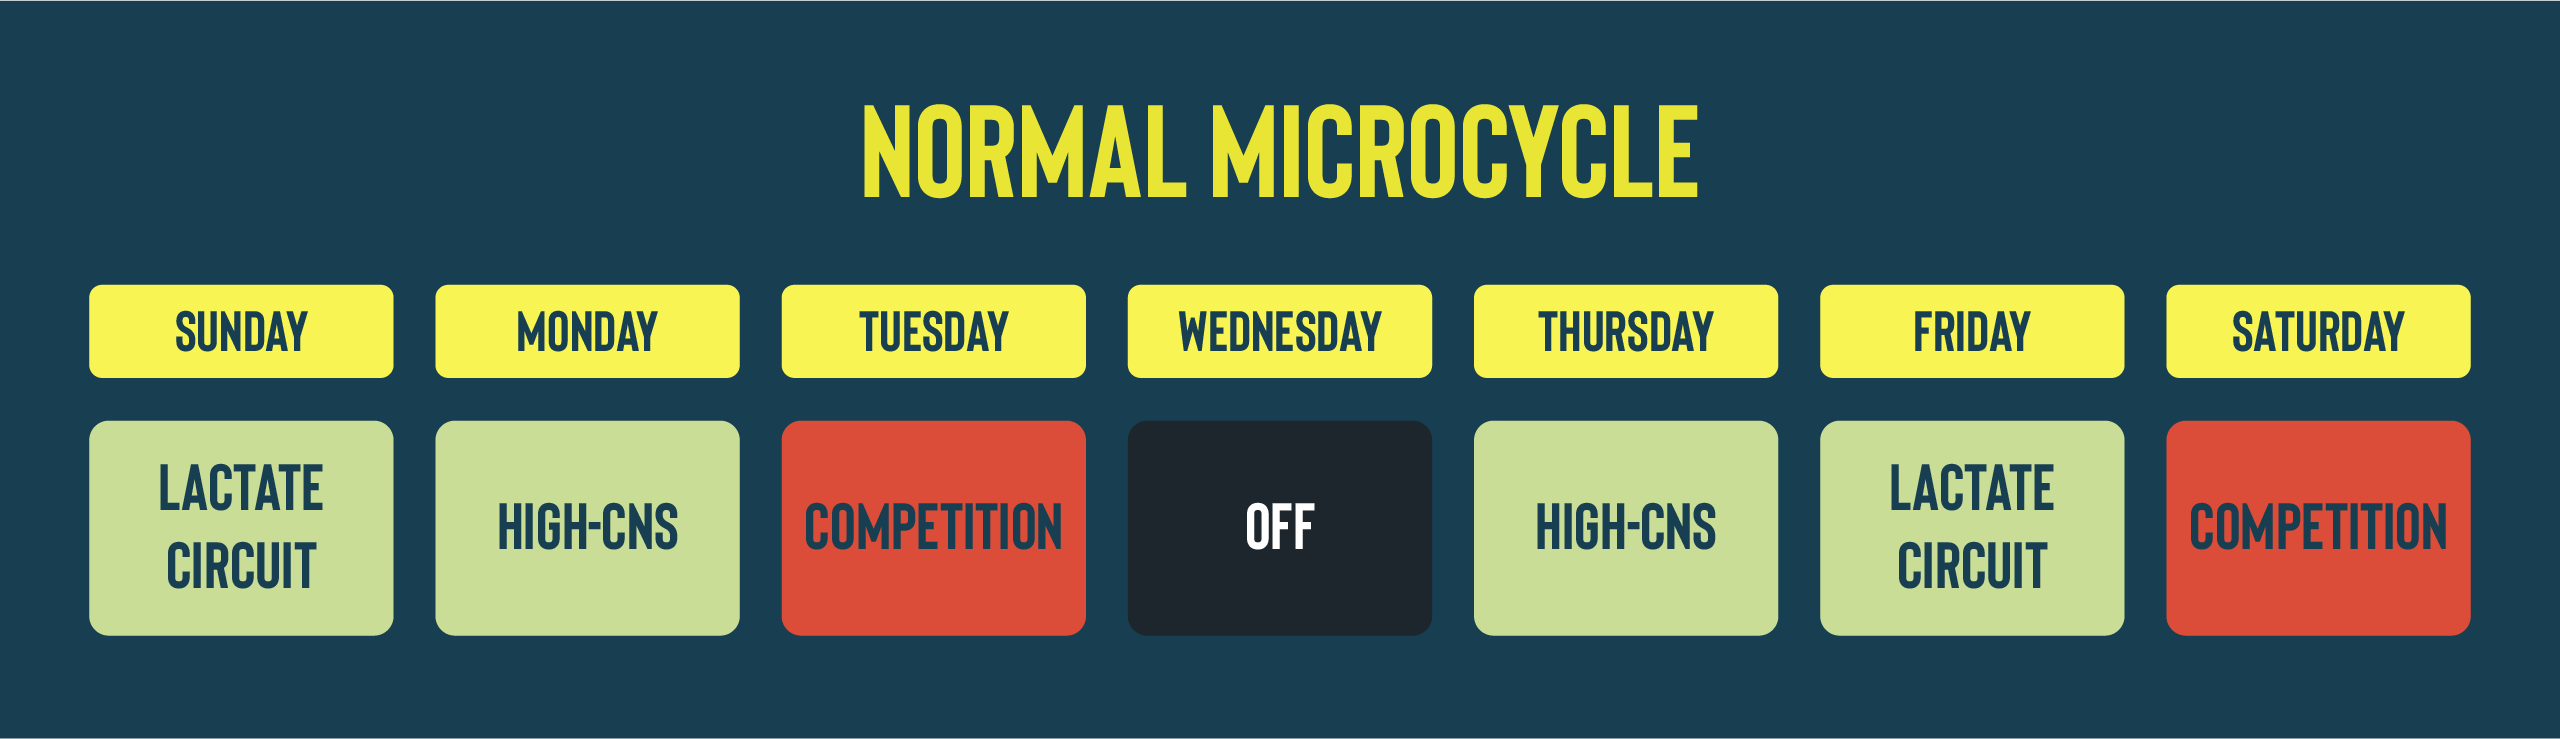

The example above is a microcycle during the competitive season. We adjust the training week by adding an extra off or active recovery day and keeping two high neuromuscular days of training.
Stage 1 of neuromuscular fatigue usually will return to baseline within a week, and a normal microcycle can ensue the following week. Return to baseline can be identified by bar path, sway, and rhythm of high frequency hopping.
Tweet ThisThe loss of refined motor control is the first stage of neuromuscular fatigue. This subtle shift can drastically affect an athlete’s technical skills, such as shooting accuracy in basketball
Adam Petway
Stage 2: Loss of elasticity
The second stage of neuromuscular fatigue is loss of elastic qualities. This typically manifests itself in longer ground contact times and greater damping ratios that inhibit elasticity.
If an athlete is taking a longer time to produce the same amount of force, they will have diminished performance in sports that require short ground contacts and reactive strength outputs. This could be particularly devastating to athletes that rely on complex fascial networks to generate high force, high velocity outputs.
For this reason, we test a countermovement rebound jump on our force plates at every workout.
The reactive strength index (RSI) of the rebound jump assesses losses in elastic qualities. RSI is the jump height relative to the contact time in a rebound jump.
When dealing with ratios, it is always good to examine both sides to understand why a value is increasing or decreasing. With RSI, if we see ground contact time increasing and jump height stay the same, an athlete is in the early onset of Stage 2 fatigue. If both are decreasing uniformly, there is a cause for greater concern.
If we are doing velocity based training, time to peak velocity is the benchmark to examine losses in elasticity. While time to peak velocity does not measure any stretch-shortening quality, it is a temporal measure that reflects where the athlete is from a reactive standpoint.


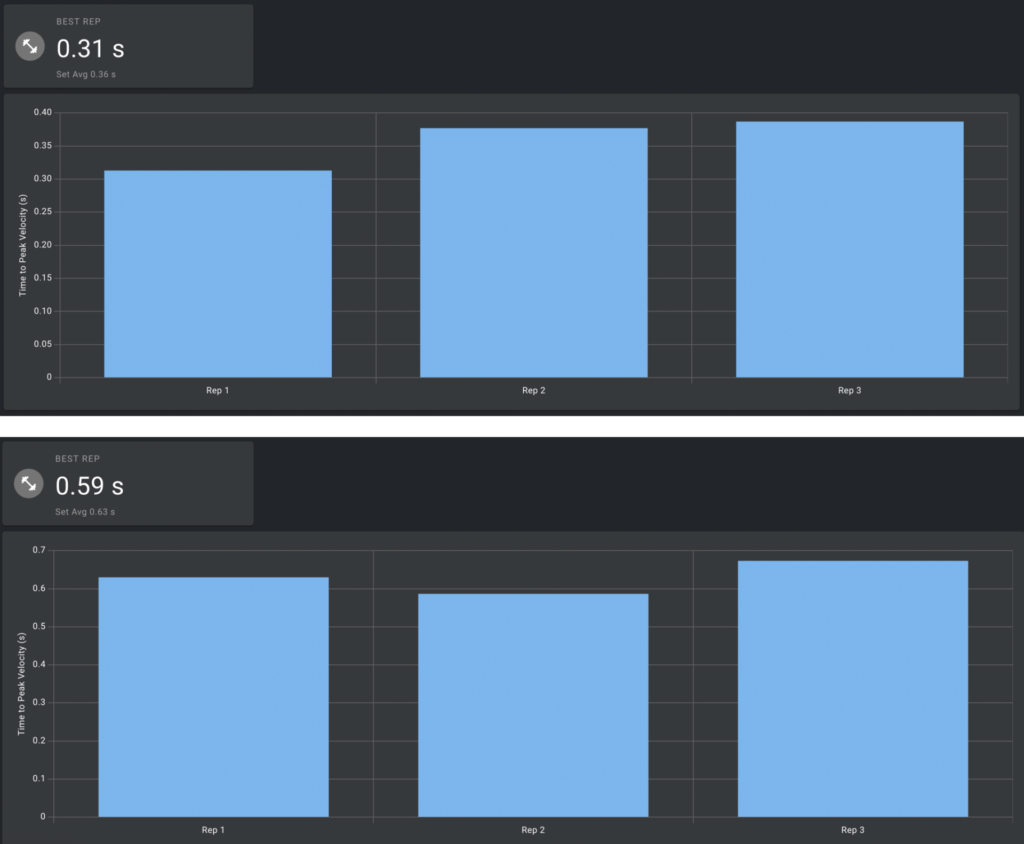
When we see the onset of second stage neuromuscular fatigue, we will usually look at spikes in acute training load or increases in density of competition as the culprit for blunting elasticity.
The intervention will typically be adjusting the high CNS neural days in training – either frequency or volume – and increasing restoration work and recovery. General exercise selections and lactate circuit based training that have a transient up regulation in androgen are great ways to offset the effects of second stage neuromuscular fatigue. These circuits are particularly beneficial during the competitive season, where coaches cannot manipulate the frequency of match play.
Example lactate circuit:
- Single leg seated jump 2 x 5
- Single leg RDL to jump 2 x 5
- Reverse hypers 2×10
- Cook hip lifts 2×10
- Dead bug press 2×10
- TRX inverted row 2×10
- Overhead walking march 2 x 20m
- VMO sled drags 2 x 20m
- Dead hangs w/ 900 knee flexion 2 x 15s
- DB split stance ISO 2 x 20s
- Keiser squat ISO hip lock 2 x 20s
- DB lateral lunge 2 x5
Example neural day:
Accelerations: 4-6 x 30m
Resisted accelerations <15% velocity loss 4 x 30m
Cleans 5×3 65-75%
- Potentiation drill: KB jumps 4×10
Split snatch 6×2 75-80%
- Potentiation drill: DB split jumps 4 x 5

Since the primary cause of neuromuscular fatigue is training and competition, we use restorative circuits as a proxy to reset neuromuscular baseline. Sometimes it can take several weeks to return to baseline, depending on the RSI from force plate testing and time to peak velocity from the velocity based training markers.
Once the athlete resets to baseline, we can return to the normal training micocycle within the competitive season.
Tweet ThisVelocity-based training provides standardized measures to track neuromuscular function and fatigue, enhancing athletic performance
Adam Petway
Stage 3: Reduced peak outputs of force, power, and jump height
The last stage of neuromuscular fatigue compromises gross outputs. Peak force and power are absolute metrics. If they are consistently trending down during the competitive season, that should be a red flag. That’s not to say that these won’t fluctuate throughout the year and shouldn’t initially dip so that athletes can super compensate at the appropriate times. But if these absolute metrics trend in a negative direction for prolonged periods of time, it can be extremely detrimental to performance.

In almost all sporting activities, the ability to produce large amounts of force in a given time is important. If an athlete cannot run as fast or jump as high, it will almost always result in decreased production within match play.
When athletes reach a chronically fatigued neuromuscular state, it is the responsibility of the technical, tactical, medical, and performance staffs to implement contingencies to return the athletes to neuromuscular baseline and restore performance.
Some coaches maintain the false belief that the purpose of training is to facilitate an environment in which the preparation consistently exceeds the volume or intensity of match play to callous the athlete and build “toughness” to perform in critical competitions. If the staff does this chronically over a consistent period of time, maladaptation will occur, and Stage 3 neuromuscular fatigue will set in.
For example, a long jumper takes six full approach jumps in competition. If they were to take 12 full approach, maximum effort jumps in training every day, they would be setting themselves up for poor performance and potential injury.
Likewise, within a 48 minute basketball game, an elite level player will cover 2,880-3,520 meters. If they were covering 6,000-8,000 meters daily during training, they would chronically exceed the volume experienced in competition, which would have a negative impact on performance.
We test a countermovement jump daily on the force plates as a standardized, repeatable way to assess neuromuscular function. Since we track it with a high frequency, we can look at trends throughout the competitive season. If jump height and peak force are consistently trending down over multiple weeks, it is a sign that Stage 3 neuromuscular fatigue is setting in. In that case, the multi-disciplinary performance team must collaborate and strategically plan how to restore the athlete to neuromuscular baseline.
In a few case studies, we have seen up to 6–8 weeks of a refractory pattern before returning to neuromuscular baseline.
With velocity based training, using a consistent incremental loading profile with standardized loads relative to the athlete’s body weight is a great way to assess neuromuscular function throughout the training year. If velocity is down across the spectrum of standardized loads, it may be a sign of Stage 3 fatigue. Systematically reducing volume and intensity of training is the best way to adjust to Stage 3 neuromuscular fatigue.


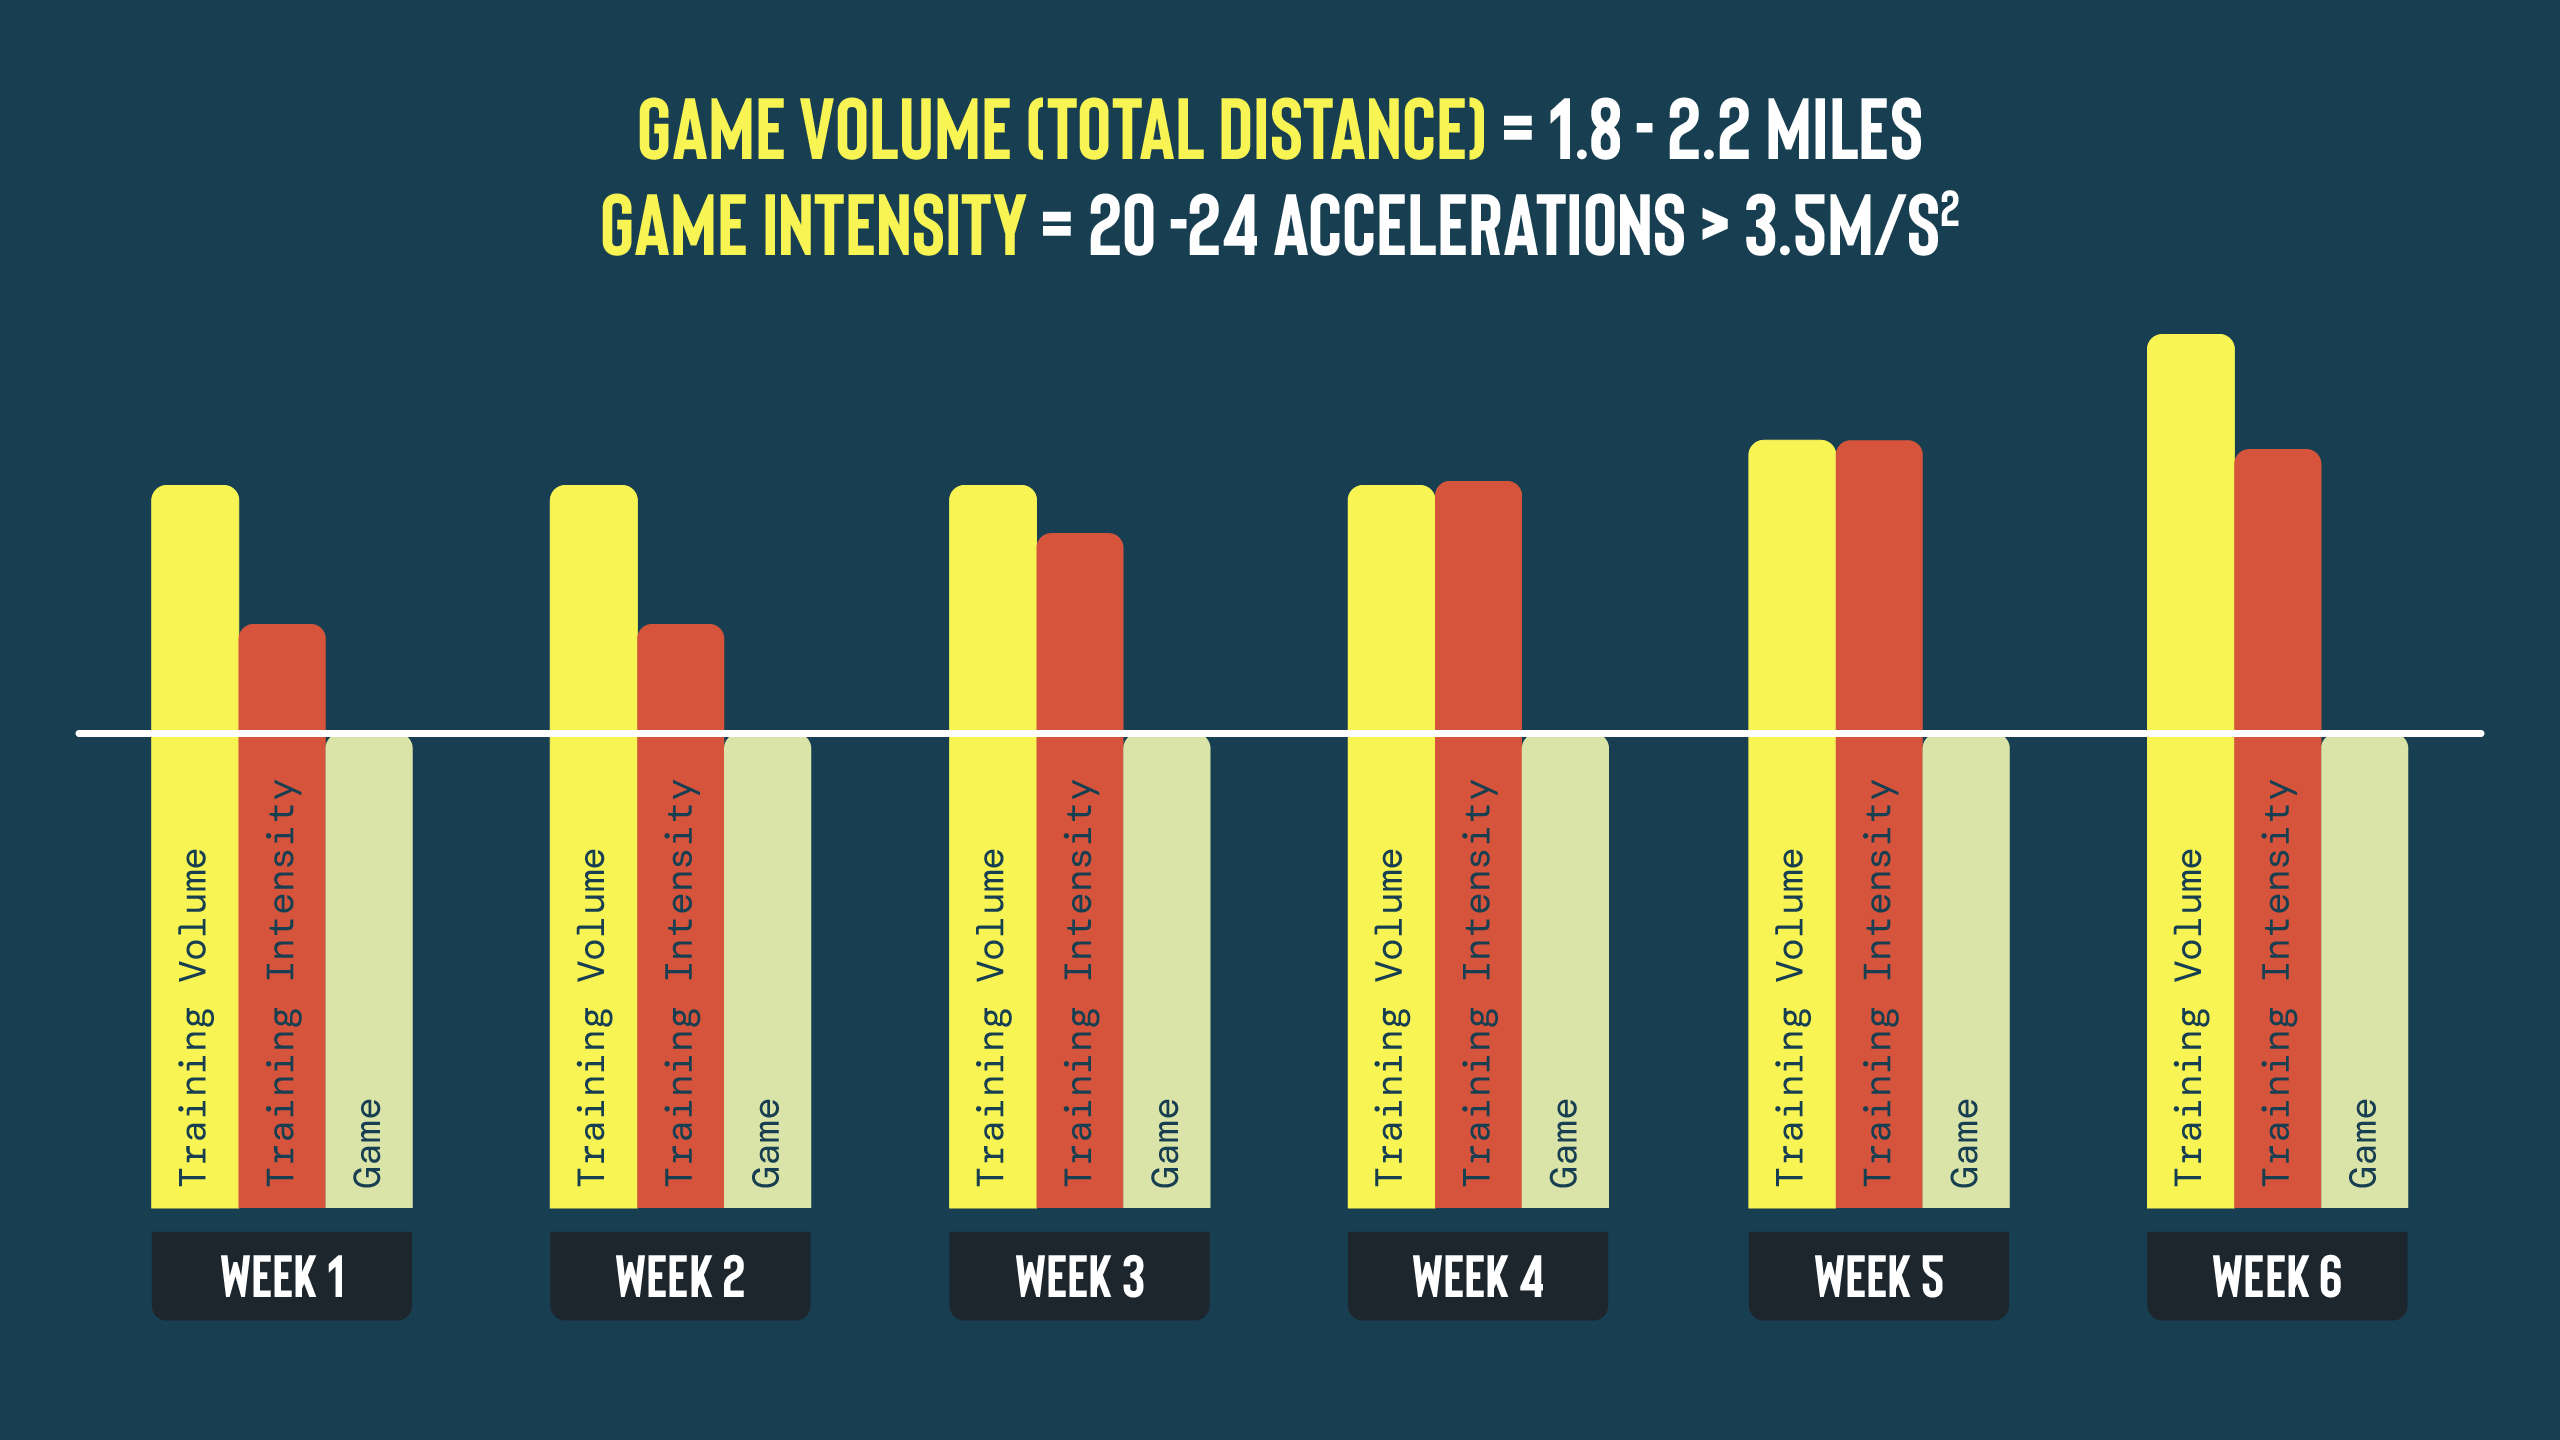
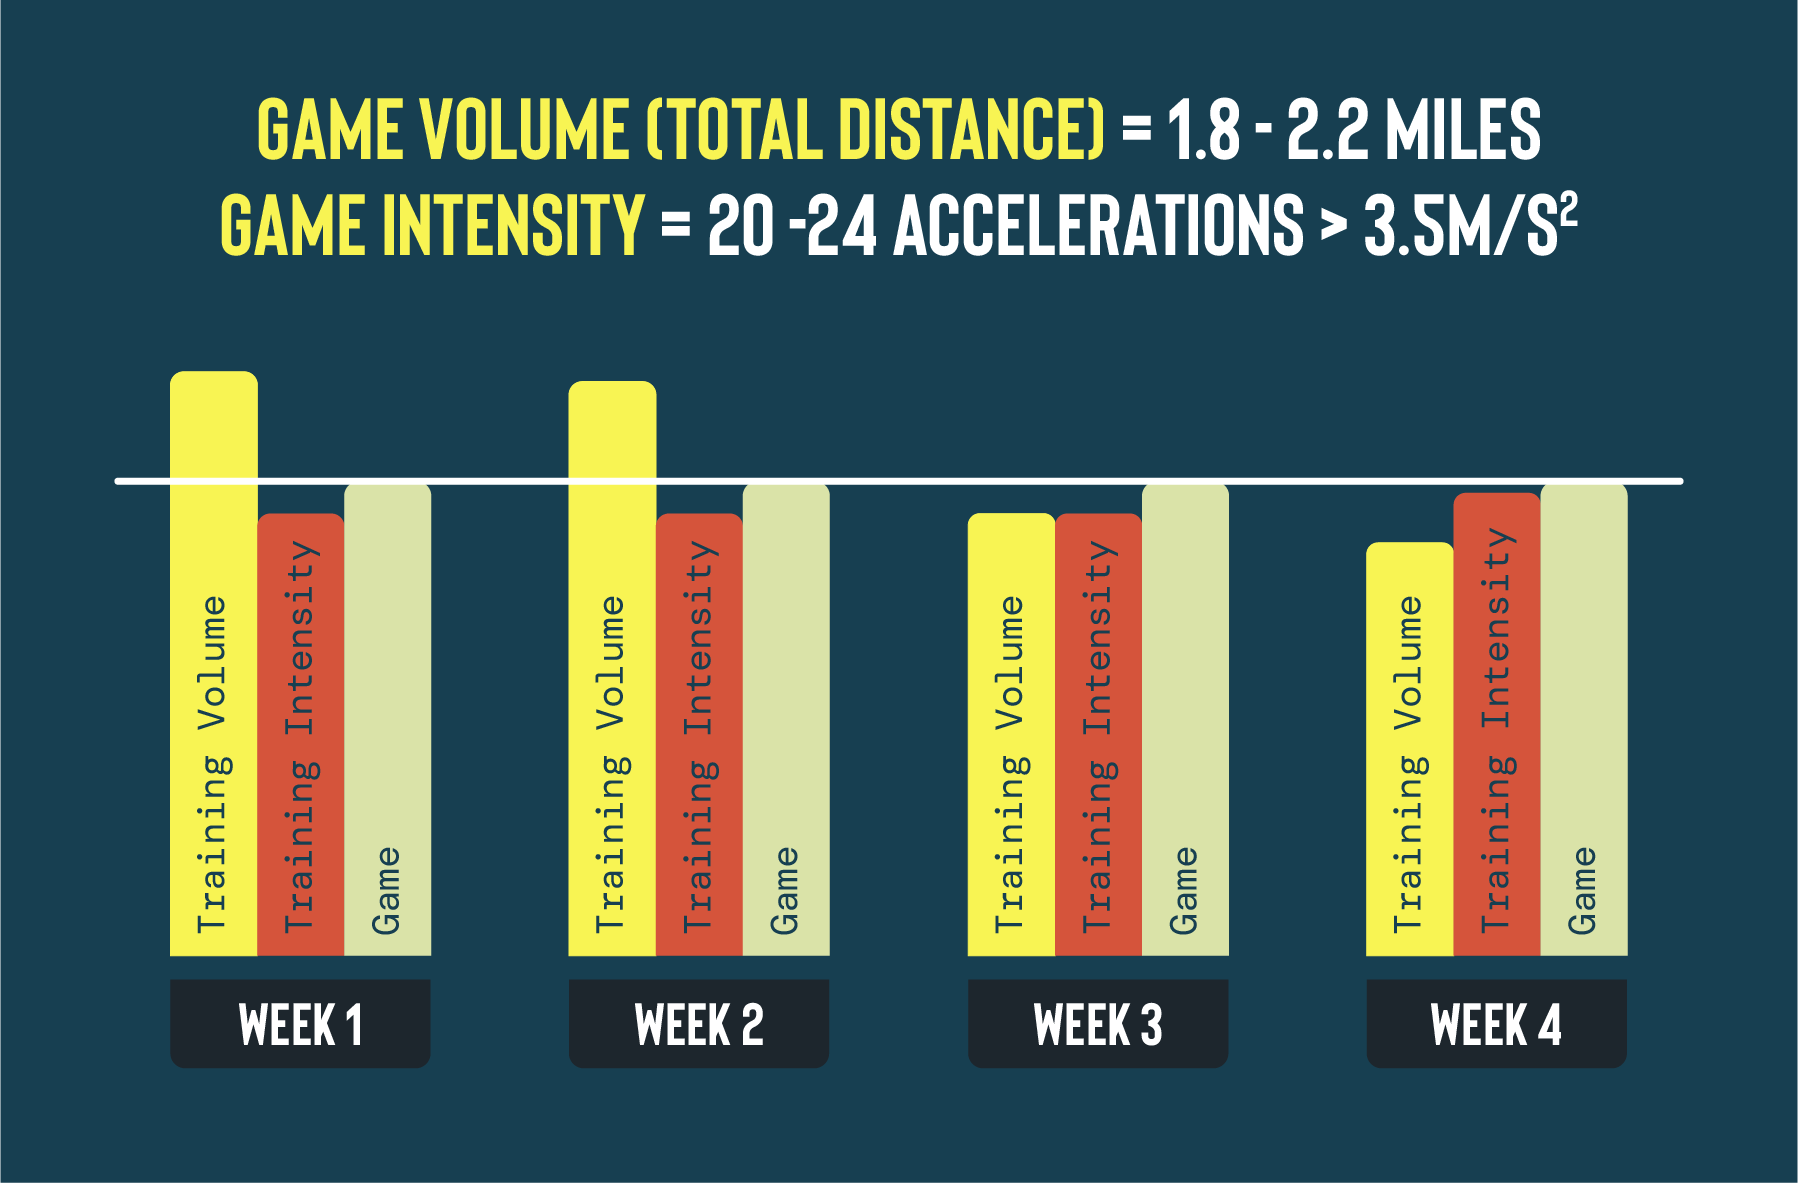
The red line and bar in the figures above represent the volume and intensity of game demands.
The total distance an athlete covers over 20+ minutes in an elite basketball game is typically 1.8-2.2 miles, and the amount of high speed running is 20-24 accelerations >3.5m/s2. Based on this, we can estimate peak game demands and how the training in a controlled environment reflects competitions.
In a typical college basketball seven day conference schedule, a team will have two competitions, four practices, and one off day.
The black bar above represents the average volume of practice for the week compared to games, and the dark red bar represents the average intensity of practices for the week compared to games. In the first graph, there are six consecutive weeks where the average volume and intensity of practice exceed that of the average game. This causes chronic fatigue to the neuromuscular system.

The second graph is the recommended four week systematic reduction of volume and intensity to return to neuromuscular baseline. Even with a four week reduction in training volume and intensity, neuromuscular baseline may not be restored and performance will suffer. Once an athlete reaches Stage 3 for a prolonged period, they may not be able to return to baseline until the post season. That is why practitioners should have a model to identify the early onsets of fatigue, so that it does not get to this point.
Fatigue can manifest itself in several different ways. Ultimately, it is our goal as practitioners to improve performance and put the athlete in the best position possible. When performance does deteriorate, it is important for professionals to be able to identify potential causes, as well as have interventions in place based on how each individual athlete presents.
Tweet ThisThe second stage of neuromuscular fatigue is marked by a loss of elasticity, showing longer ground contact times and diminished reactive strength, which can devastate performance in sports requiring quick, explosive movements
Adam Petway