

Velocity based training (VBT) has become a common term in sports performance. The boom in technology that quantifies the velocity of key exercises and movements has spurred the popularity of this “modern” training method. A practical – and safe – definition is that VBT is a method that uses velocity to inform or enhance training [1].
Despite the positive transfer that VBT approaches likely offer, coaches and researchers can get a little frustrated with the term VBT. After all, almost all training has a velocity component, so wouldn’t that make almost all training velocity based to some degree?
Practitioners would be better off framing VBT more as a general training construct consisting of numerous methods that all involve measuring velocity as the primary output to inform the training method.

Common misunderstandings about how to use VBT
When it comes to applying VBT, I generally end up having four types of conversations. These typically stem from seeing VBT as a single method rather than an overarching construct.
– Conversation #1: VBT is only about maximal training and lifting as heavy as possible (or vice versa).
– Conversation #2: VBT is impractical for our setting because we have too many athletes and it wastes time in sessions that could be dedicated to training.
– Conversation #3: Other methods are more effective than VBT.
– Conversation #4: Only advanced athletes with high training ages should be adding speed as a training variable.
Conversation #1 typically arises from a misunderstanding of how to apply concepts like the load-velocity relationship to programming. VBT can enhance the practitioner’s understanding of how a simple load-velocity profile can shape training. While velocity feedback can help improve the athlete’s intent, that doesn’t imply maxing out every lift and session. It also means more than just implementing faster movements at the expense of building strength.
Conversation #2 raises a valid, practical dilemma that a lot of coaches may face in a large team setting. But this doesn’t mean we can’t use VBT to a certain degree. Certain methods of VBT may be impractical in those settings and cannot be applied to their full advantage. This objection goes back to the perception that VBT is monolithic – in this case, that it’s only about using load-velocity profiles in real time to predict 1 repetition maximums – when it is really an umbrella term for an array of different methods.
The third conversation presents another valid argument. I don’t think anyone ever set out with the intention of replacing other types of training with VBT – it is just another programming option. Coaches can use VBT as a supporting method that may yield useful information to guide them towards their desired training outcomes, while still using their original training method without any harm to its underlying principle.
Finally, VBT is for some reason perceived as an advanced training methodology that is reserved only for those who have earned it via a high training age or advanced skill levels. While partly true, this is a potentially flawed interpretation of some of the previous power training research. It also evinces a misunderstanding of the potential uses for VBT. VBT methods have a role at all stages in the training process for an array of training ages, depending on what you are trying to achieve.
Overall, VBT methods are complementary – not contrary – to other established training methods and applicable to a range of populations and contexts where coaches have established their application and processes.
These conversations, my experience and research have led me to group VBT methods into three separate categories: assessment, intent and monitoring.

Tweet ThisMisunderstandings about VBT often stem from seeing it as monolithic, rather than a diverse set of methods to enhance athletic training
@CTsportsci
Building assessments on velocity based training methods
Coaches considering implementing VBT have hopefully started with the very basic question of why. Why do they need VBT for their program?
The assessment category is informative, letting the practitioner use the information to describe their training, assess the group or individual, and make decisions affecting the training process. For the most part, coaches can do the assessment without changing their current training process at all. Since VBT methods can be complementary to a current training program, the first layer that a coach can add is assessing their current training process and beginning to describe it. For example, what are the typical velocities the athletes are hitting for given exercises during a specified training block?
For example, a coach may program percentage based lifts based off a previous 1RM test, or use rating of perceived exertion to gauge intensity. They can then track velocity in the background, assessing how the velocity changes relative to their prescription of the desired intensity. Methods like this are simple starting points where a coach can assess whether the athlete is in a general training zone aligned with the goal of the prescribed session.
Bryan Mann[3] developed a generalized way of assessing this quite simply in relation to concepts like percentage based training methods.

This becomes a pretty useful way to quickly judge a person’s training intensity against some predetermined velocity zone. Coaches can then evaluate whether to increase or decrease the intensity based on the desired training goal.
While general zones are useful, they vary between individuals and exercises. In the example above, the athletes’ velocities decrease more than one zone with the same training intensity. Nevertheless, this is the easiest form of assessment one can perform using VBT methodologies. However, despite our like and frequent need for dichotomizing in S&C, coaches should be more interested in the individual athlete’s load-velocity relationship for the given exercise and how it may inform training processes.

VBT for load-velocity profiling
We can quickly get a sense of potential training approaches by visually inspecting individual athletes’ load-velocity profiles to gauge what qualities they possess for that specific exercise.

The above example shows three different load velocity profiles. A quick inspection of this data suggests that the green athlete is able to produce higher velocities at lower loads, but has a steeper slope suggesting lower overall strength (crossing the theoretical 0 m/s at a lower load than his peers). The dark blue profile is slower than the green athlete at lighter loads, but is then able to produce higher velocities at higher absolute intensities, showing a more progressive slope with a lower intercept but higher theoretical 0 m/s. This suggests he is stronger than the green athlete. The yellow athlete’s profile may be somewhat representative of an “optimal profile” for this exercise, showing a more balanced profile with faster velocities across each respective load than both of his peers and a higher overall load at theoretical 0 m/s.
In pairing the LVP information with another simple method to gauge the assessment output within this exercise (relative strength: 1RM / BW), we see that the green athlete has lower relative strength compared to his peers but is also 10-15 lbs lighter, which may explain why he is biased towards speed.
So why would we need velocity, when we can just use relative strength?
As practitioners, we would likely make the decision to prioritize strength work for this athlete, exposing him to more higher loads than lighter loads; and, if appropriate, hypertrophy, due to overall body weight being consistent with other guards in this league, assuming this influences performance. But we wouldn’t know if he is actually more effective at the lighter loads. This simply allows for another layer of information to assess the athlete’s “strengths” – in this case, being more explosive than at least one of his positional peers.
The blue athlete has decent relative strength ratios for this exercise, so we would probably prioritize exposure to lighter loads and unloaded conditions in an attempt to improve speed while maintaining strength. The yellow athlete, who shows a more balanced profile, can likely benefit from other exercise variations (e.g., loaded jumps) as it is unlikely that any further improvements in 1RM for this exercise are relevant to transfer of performance in basketball.
We have used the LVP information to create some simple training heuristics that may be beneficial to each athlete. We could, alternatively, argue that exposure across the LVP may also be beneficial as a training process to improve the athletes’ ability in this exercise. Nevertheless, we can see how a relatively simple VBT assessment can complement other means of assessing training to inform a training approach.
The LVP also has further utility in that we can predict an athlete’s 1RM every time they train and use this information to assess progressions and improve our training approach.
Tweet ThisVBT enhances training by using velocity to inform practice, moving beyond the misconception that it only focuses on maximal lifts
@CTsportsci
Predicting 1RM from the LVP
One of the primary uses of load-velocity profiling is the ability to predict an individual’s 1RM. We can do this without actually performing a 1RM test to failure, which can be beneficial for a few reasons.
First, the submaximal nature of this type of assessment also means it can double as training sets, e.g. athletes can perform their typical warm up and working sets while you use this information to plot the 1RM prediction. Next, it reduces the reliance on a singular max out day. We now have a way of assessing the undulating nature of 1RM output on a day to day and week to week basis, without having to do a true 1RM every time we train. Third, it provides a basis for updating the day’s training prescription in real time, with the right access to the information and set up of data analysis techniques.
Before we run through an example, it’s important to introduce the concept of minimal velocity thresholds (MVT), displayed as the red dotted line in the above examples.
Terminal velocity is the slowest velocity to achieve a repetition before failure. Every exercise has one [6]. MVTs vary between exercises [1], and may vary between devices used to track them based on the variation of detection methods and the reliability surrounding these devices (e.g., linear position transducer, camera based system or accelerometry). Therefore, practitioners should investigate MVTs internally with their device, such as performing a pilot validation study of 1RM velocity values for your population. Use research established thresholds as flexible guides if you cannot establish these MVTs for your athletes.
It may be impractical, at times, to establish an observed MVT for an individual through a 1RM assessment. For example, consider a new freshman athlete in week one of training camp. One potential surrogate option is performing reps to failure at a given load and observing the final repetition for useful information that closely relates to the MVT. However, some research advises caution with this approach due to its poor reproducibility for certain exercises [7].
The ability to use a method that is generally easier to implement with athletes with lower training ages is a nice-to-have in the back pocket. This won’t always be perfect – some exercises may show worse relationships, such as the dead lift [8]. But it will still give a general sense of what to expect to observe for an exercise.
For exercises that don’t utilize the stretch shortening cycle and start from a dead stop (like the dead lift), you are likely going to want to use an observed 1RM test value or an MVT threshold established within the literature for reference. Below we see that reps to failure at a submaximal load is an acceptable method for estimating barbell bench press minimal velocity thresholds for a group of basketball players.
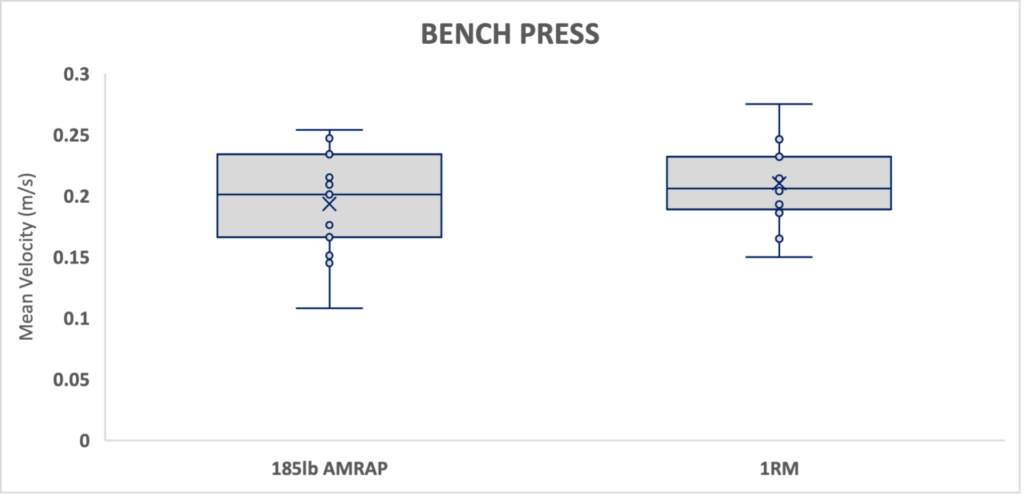
With your determined MVT – which you ultimately decide and adjust – you are now able to predict an individual’s RM in a spreadsheet or coding software.

Tweet ThisVBT’s real-time feedback improves athlete intent without maxing out, balancing faster movements with strength building for optimal performance
@CTsportsci
Being aware of the errors in load-velocity profiling
Bear in mind that profiling carries errors, and we should discuss these so we can audit them when using these methods.
First, standardize all lift positions (i.e., range of motion) as much as possible. For example, during the bench press an athlete may display a higher velocity on a 1RM test compared to the load they used before as they approach 1RM loads. On the final rep, the individual changed their lifting position, elevating the hips and pelvis, resulting in a slightly altered bar path and subsequent increase in concentric velocity. This alters the mean concentric velocity and creates a higher value than those loads lifted before.
Coaches should be vigilant for these technical changes and lay out the degrees of freedom before using the observed velocity.

Second, assess the goodness of fit for your prediction. Ideally, the R2 value of your regression model should be closer to 1, indicating that the model explains more of the variability of the data around its mean. Lower values may represent a poorer fit and, therefore, may indicate more variability within the prediction model. In the case of the above LVP, the R2 value = 0.99.
Coaches should also look at the model’s residuals (observed value – fitted value from the prediction) where the predicted values can be calculated using the equation from the trendline, in this case -0.019x + 1.2237, where x is the load value. A model fits well if the residuals are small and there is no bias present, i.e., the values are evenly distributed around 0 with no observable pattern or trend.
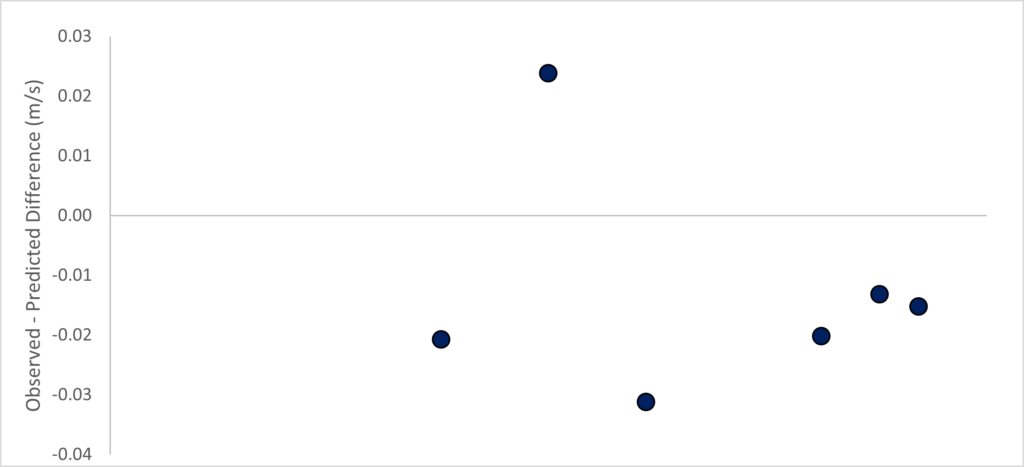
Calculate the standard error of the measurement (SEM) and, subsequently, the standard error of prediction (SEP). Embrace these outputs.
As we are predicting a value, the SEP is the form of standard error we want to use in this case [9]. We then calculate the margin of error within our prediction using a specific confidence level. In the above example, a 90% confidence level gives us a range of loads that may contain the true value for the exercise.
We can make a judgment call whether to have more confidence (e.g., 95-99%, which is a wider interval) or less (e.g. 80-90%, a narrower interval) in our prediction and also whether to use the prediction or not. Determine how much error is acceptable to use the assessment. In the example above, the SEM is 11 lbs (~5 kg), which is roughly 2.3% of 1RM. This is low enough to be acceptable to use the model.
I often see discussions of not using 1RM predictions from an LVP because they are inaccurate. Satisfy this objection by collecting velocity data during 1RM max out sessions and compare the observed and predicted values to validate the model. This is also an easy way to individualize MVTs for future predictions. LVP is not always perfect – there may be outlier velocity data that you have to clean.
Calculating SEM and performing some simple model diagnostics can help you decide if your data is useful for training purposes or not.

Using the assessment to inform training
Using this VBT method doesn’t have to be overly complicated. A practical method of applying the 1RM prediction to programming (for those more familiar with percentage based training) is creating a 1RM table.
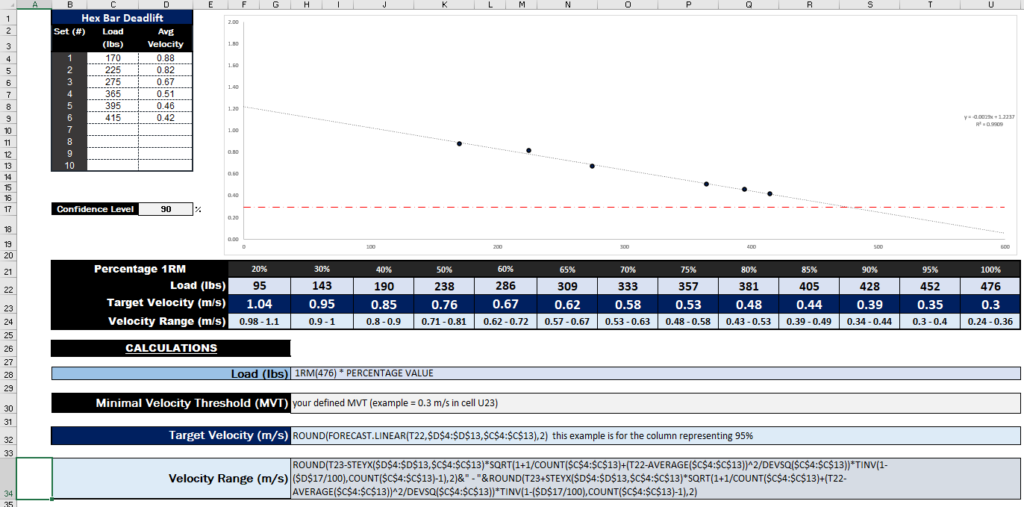
This is pretty effective for large groups. The table can also display the velocity zones specific to each individual, creating a feedback loop that includes what load they could use and their range of expected velocities for that load, dialing in the training for that day. This again demonstrates how VBT methods complement already established training processes – in this case, percentage based training – and integrate fairly simply with large groups.
For example, say that in today’s training we want to work on maximal dynamic strength, which often means loads >80% 1RM. For the athlete above, we would target around 380 lbs with a velocity of 0.48-0.58 m/s. As the athlete progresses, we can easily refer to the table to see where they are for the given day based on their velocity output, comparing the observed values to the predicted values. When the athlete moves faster, we can recommend increasing the load to get to the desired velocity range. If the athlete is moving more slowly, we can lower the weight. This circumvents having to do live LVP and predictions to get the 1RM for the day.
Expanding on this method, a more detailed approach entails creating varying training ranges before each session using the lower and upper thresholds of the 1RM prediction. This is particularly effective for smaller groups, like a squad of about 16 basketball players. I’ve coined these training zones “gain,” “maintain” and “restore,” while some of my athletes call them green, yellow and red, respectively.
The “gain” zone uses the predicted absolute maximum – the most weight at the slowest velocity that the athlete could perform – and biases the session loads a little higher. Some coaches call this a competition max 1RM.
The “maintain” zone is based on their current profile, using each player’s MVT. This would be the normal program ranges they would use if no other options are on the table.
Finally, the “restore” category uses either the lowest possible 1RM value or a pre-determined higher velocity threshold, which reduces the training intensity. This offers a lighter training stimulus for the day or, in some cases, alters the primary exercise completely.

The above example shows three different training ranges for an athlete using the percentage based table, but this time showing alternative loads based on their individual response while performing the primary exercise. Session flow is important, so we make adjustments in real time based on velocity ranges and targets so we don’t need extensive input from the athletes or coaches. The athlete simply performs these assessments as part of our warm up series for the primary exercise with the VBT training tool. In our case, that’s the Perch system.
Athletes perform two warm up sets of submaximal loads (same loads every session) with about 55 lbs difference between light and moderate loads. Using pre-established velocity ranges for these loads, the athletes follow the decision tree above to see where they fall relative to their previously established ranges.
We also employ a subjective override. No one knows an athlete’s body better than the athlete himself. The athlete is able to use the VBT information to make decisions based on his or her own subjective readiness. This isn’t a formal assessment. It’s an intuitive way to have the athlete engage in their own training process and utilize the program as a guide, with their velocity numbers as reference.
This provides a way to us the data to guide the session. The coach and athlete can decide the sets and rep ranges and adjust the intensity based on the specific output displayed within the session.
Tweet ThisVBT is not just for advanced athletes; its methods apply at all stages, offering a complementary tool across various training ages and goals
@CTsportsci
Where VBT assessments fit into an S&C program
Coaches can build a robust assessment process through a range of VBT methods that can then influence training. The assessments can range from simple description of general training zones to more analytical approaches for load velocity profiling that lean into statistical analysis.
The VBT approach is best reserved for your primary exercises, the ones that deliver the main physiological stimulus in a session and that most likely require a more detailed approach to prescription. Other established training approaches are more applicable to accessory work: percentage based methods, relative loads, rating of perceived exertion, reps in reserve. All of these still interact with a VBT approach, as VBT assessments may complement the progressions of these exercises, but may not be required at all times.
Tweet ThisIncorporating VBT can start with simple assessments, allowing coaches to track velocity changes and align training with desired intensity levels
@CTsportsci