

Force plates provide a way to take a new look at the dynamic strength index (DSI). At the core of all the things they do, force plates report the maximal force an athlete puts into the ground over a given span of time. That leaves practitioners only a short step away from the key performance attribute of expressing a large amount of force as quickly as possible.
The dynamic strength index is the ratio of these two attributes: maximal force production to maximal amount of force in a short duration of time. To simplify it even further, DSI is the ratio of “maximal” to “fast maximal.”
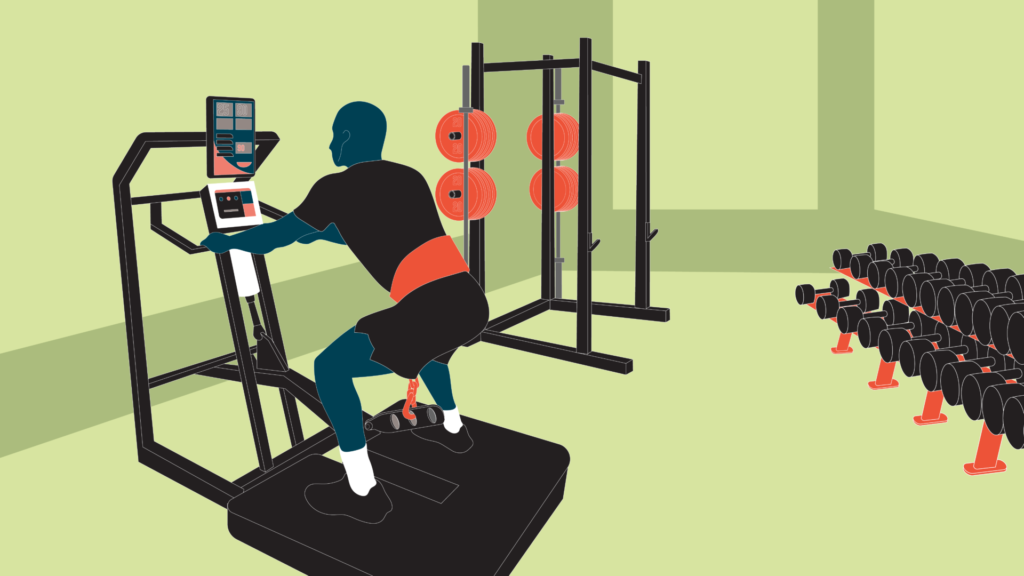
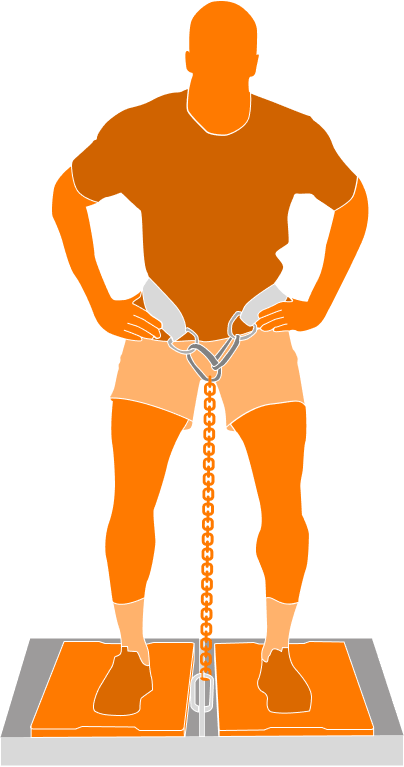
Research into the DSI aimed to identify a norm for specific athletic populations that could be the basis for prescribing ballistic or strength training. The tests themselves have changed since the first study. The isometric mid-thigh pull (IMTP) has made way for the more comfortable isometric belt squat (IBSq) to assess maximum force; while a countermovement jump (CMJ) measures the ability to apply maximal force quickly.
This article will examine the question of normative ratios, offering a solution that practitioners across sports can use with any of the testing implements they or their athletes prefer.
Tweet ThisThe dynamic strength index is the ratio of these two attributes: maximal force production to maximal amount of force in a short duration of time. To simplify it even further, DSI is the ratio of “maximal” to “fast maximal.”
Alex Beljic
Data loss in the one-dimensional DSI
Dynamic strength index has proven value across standardized prescription ranges, and for categorizing certain athletes as “fast” or “strong.” But the DSI has one major fault: it is strictly one-dimensional.
While we can (obviously, easily) compare an athlete’s ratio to that of their peers, we do so at the expense of knowing their relative capacities on the two components of the ratio. This issue first revealed itself to me while testing athletes at the University of Southern California.
| CMJ peak force (N) | IBSq peak force (N) | DSI ratio | |
| Athlete 1 | 1,250 | 2,500 | 0.5 |
| Athlete 2 | 2,500 | 5,000 | 0.5 |
Visualizing DSI on a plot of CMJ peak force vs. IBSq peak force, we can put both athletes on the diagonal y = .5x, and say that everyone above this line needs more “strength” training and everyone below needs more “ballistic” training.
Arguably, if the two athletes in Table 1 are playing the same sport, one is much more capable of expressing force than the other, and therefore may have an entirely different physiological profile and needs. This may be due to body mass, genetic potential, training age, or even training methodology.
Knowing these differences, should these two athletes have the same training?

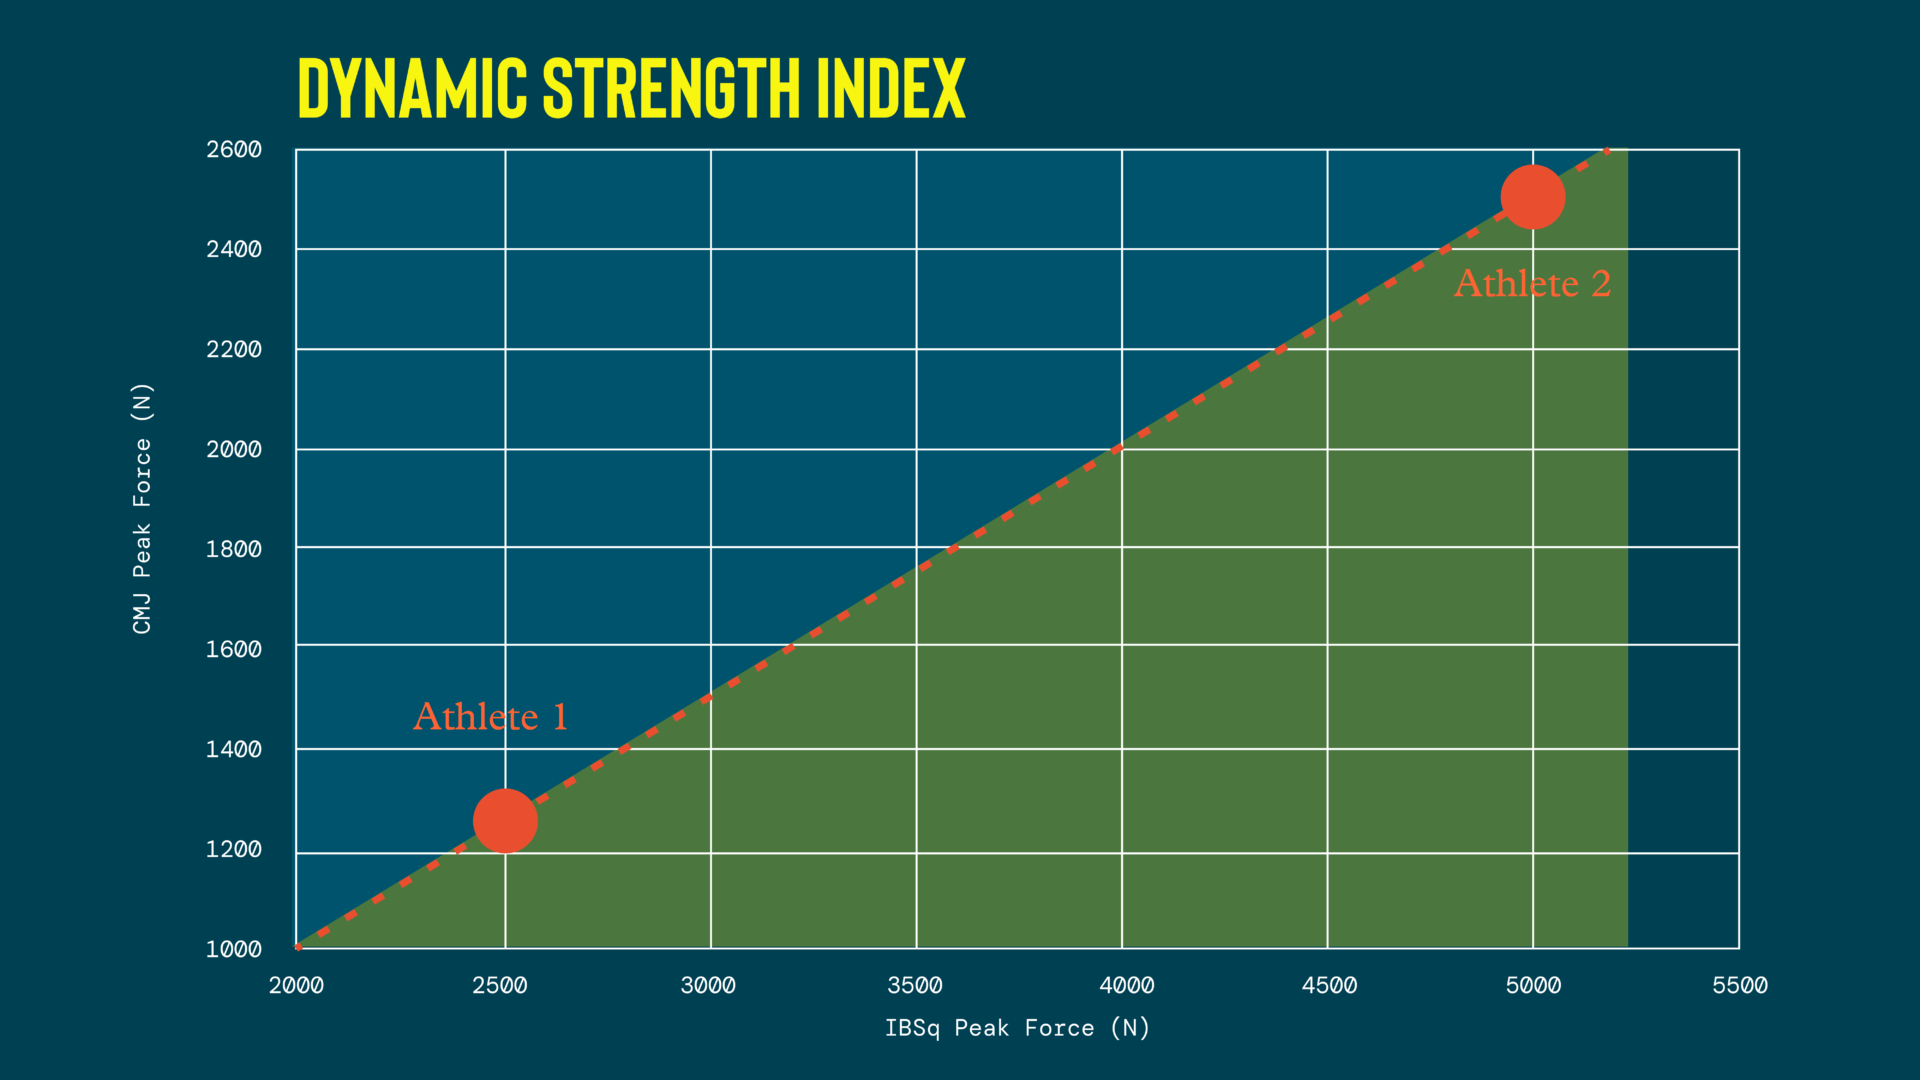
Knowing that the IBSq is the expression of strength and Athlete 1 is half as strong as Athlete 2, how comfortable would we be training Athlete 1 in a more speed development setting and foregoing strength work?
The doubt around this question points toward some minimum IBSq force output that should set the context for evaluating DSI. Once we accept that, the next question to re-evaluate is how to apply the accepted DSI principles regarding training prescription.
Tweet ThisArguably, if the two athletes in Table 1 are playing the same sport, one is much more capable of expressing force than the other, and therefore may have an entirely different physiological profile and needs. This may be due to body mass, genetic potential, training age, or even training methodology.
Alex Beljic
Working from both tests yields a 2-dimensional approach
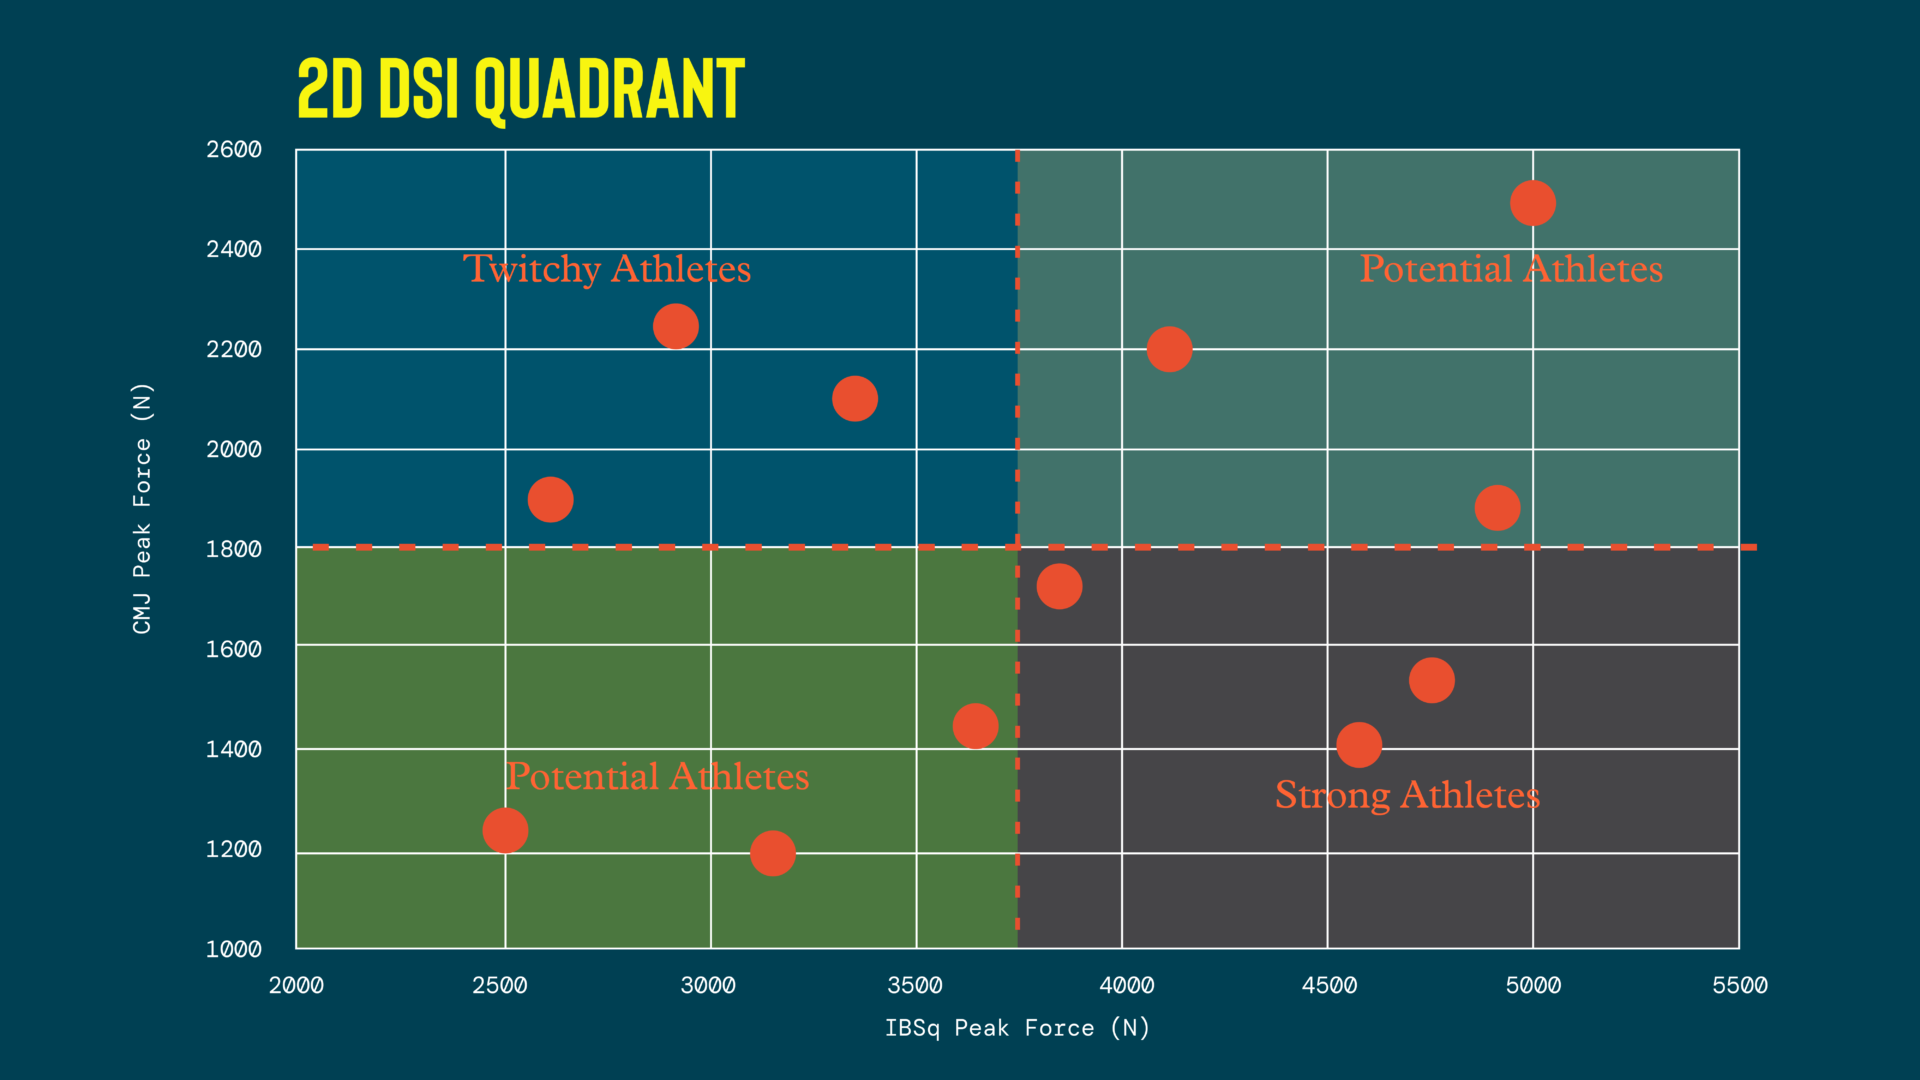
Plotting a larger sample of athletes shows that half are better at the CMJ test, and half at the IBSq. Now we have a more holistic and practical perspective on each athlete’s ability, irrespective of their DSI; and how they stack up on both the “strong” and “fast strong” qualities compared to their peers. Figure 2 shows the medians for the two tests, but does not suggest a DSI cut-off.
This view of the peak force relationship supports the case for training these athletes differently, in much clearer terms than DSI alone could.
This additional layer of evaluation helps paint the picture relative to the population of the sport and separates our lower force output athletes from our higher ones.

The athletes in the top left quadrant excelled in their CMJ peak force test but were not as good on the IBSq. As we’re using the measure of the CMJ peak force to express their ability to generate force quickly, we will categorize them as “twitchy.” The bottom right has the athletes with the highest IBSq scores but relatively low CMJ. These athletes are able to produce a lot of maximal force, albeit slowly. We can call them “strong.” The top right excel at both of the physical tasks. They are strong and twitchy: they are “powerful,” as power is the product of both force and velocity.
Those on the bottom left side were neither. They need to improve both the strength and velocity aspects of their physical performance. Put them in the “potential” bucket.
Once we’ve understood the archetypes, organizing their training becomes easier: four training groups, four prescriptions (Figure 3).
Starting with the “potential” group, given their low propensity for force output, these may be athletes with a lower training age. They require both qualities, but may be better off starting with strength training to set up a base for ballistic development later.
The “twitchy” athletes require more strength training in their development period; while the “strong” group needs more ballistic training in their development period.
The “powerful” athletes, those with high CMJ and high IBSq forces, don’t require targeted work around either quality. We can individualize their training based on individual goals, or prescribe lower volume so they can focus on the technical elements of their sport.
Similar to the DSI ratio itself, the value of the DSI quadrant is how useful it is in large team settings. The more athletes and data the performance practitioners have, the more accurate the categories and the median at which the graph separates. Imagine a data set of hundreds of athletes at a football club, from the academy to the first team. Having a clear view of each athlete with respect to normative data for their age, position, and long-term development could be invaluable to the entire department.
That leads to another benefit of this approach: its contribution to longitudinal measurements. Athletes who are in the “potential” group this year could develop into “twitchy” or “powerful” athletes by next year. Tracking these performance changes ensures that their progress benefits their sport performance, and that future training decisions reflect the work that came before.
Tweet ThisThe athletes in the top left quadrant excelled in their CMJ peak force test but were not as good on the IBSq. As we’re using the measure of the CMJ peak force to express their ability to generate force quickly, we will categorize them as “twitchy.”
Alex Beljic
Team-wide profiling to build a “powerful” group
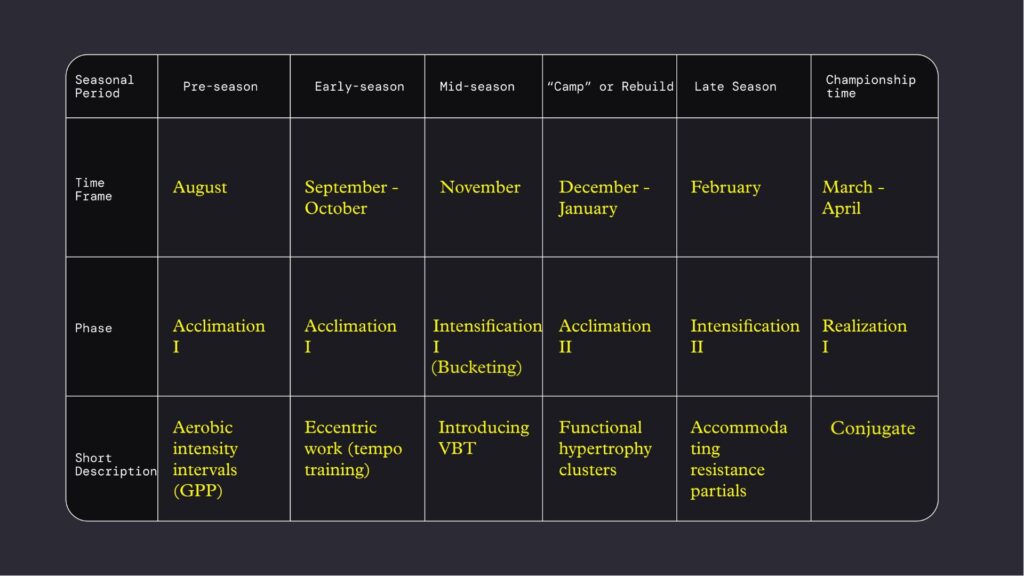
The prescription separation happens in phase 3, the mid-season, where we start separating swimmers based on their testing numbers and their corresponding quadrant. Swimmers in our “potential” and “twitchy” groups will gear more towards strength development. Swimmers in the “strong” and “powerful” groups will do more work related to speed development. The prescription differences are not all encompassing, but only in our core lifts: squat, bench press, and dead lift.
| Order | Exercise | Sets x reps |
| A1 | Hang power clean | 4 x 4 |
| A2 | Box jump | 4 x 4 |
| B1 | Back squat | 6 x 3 Groups 1 – 2: <.55 m/s velocity Groups 3 – 4: >.85 m/s velocity |
| C1 | Physioball hamstring curl | 3 x 8 |
| C2 | Dumbell split squat | 3 x 8 |
| C3 | Keiser calf raise | 3 x 8 |
We will generally work on an athlete’s “weakness,” whether it’s speed or strength, earlier in the season. As we near our championship season, we switch the prescription to their strengths, with a bit less volume. The goal at the end of the season is to get as close as we can to the “powerful” quadrant.
Tweet ThisSwimmers in our “potential” and “twitchy” groups will gear more towards strength development. Swimmers in the “strong” and “powerful” groups will do more work related to speed development. The prescription differences are only in our core lifts.
Alex Beljic
Long-term development towards a “powerful” athlete
This example follows an athlete’s yearly journey through different macrocycle training prescriptions. The athlete was in the “potential” quadrant relative to all athletes in his first year, so we assigned him a significant volume of strength work.
| Time frame | Year 1 | Year 2 | Year 3 |
| Quadrant result | “Potential” | “Strong” | “Powerful”’ |
| Implementation | “Strength” | “Speed” | “Advanced training or MED” |
He developed into the “strong” category for his second year, leading to substantially more velocity-based training. In year 3, this athlete tested into the “powerful” category. Now he had more specific training based on his event, and currently has the eighth best time in the NCAA for that event at mid-season.
Someone in the “powerful” group can have individualized programming in certain phases of the year when we start bucketing all athletes.
After more than two years in the program, we could add more specific training to his minimal effective dose prescription in year 3.
Because he had begun to express fatigue in the kicking part of the 200-yard swim, we programmed 6-8 sets of 10 reps of a fast, anaerobic, recovery-focused lower or upper body. This swimmer had about 10-12 kicks per 25 yards. We focused on rebuilding the fatigue resistance of the underlying muscle tissue through a similar timed challenge in the weightroom: 10 reps per set with 15 seconds recovery.

Working against the calendar: Training for a qualification race
| Year 1 | Year 2 | Year 2 post-season | |
| CMJ peak force | 2,139N | 2,256N | 2,282N |
| IBSq peak force | 6,156N | 6,821N | 6,245N |
| Group | “Powerful” | “Powerful” | “Powerful” |
| Prescription | VBT training | Medium volume VBT group | MED + Specific anaerobic/alactic intervals |
The final example follows an athlete who had six weeks until an event in which he had to swim a personal best time to qualify for the Olympics.
The athlete had tested into the “powerful” group at the beginning of the year, and was still in that bucket (with a slightly better CMJ peak force output) when we retested after the “championship” segment of our season.
This athlete was training on a medium volume VBT or “speed” prescription all year until this point, when we noted that this approach had resulted in the same output. We reduced his volume until it was a total of 6-8 sets x 2-3 reps of strength and speed work per week of all exercises. [4] This athlete’s main issue was lacking the energy to last the full 22 seconds in the water. Alongside his swimming, we added some anaerobic / alactic intervals to hopefully extend his output capacity a small amount before his crucial race.
The attendant reduction in volume, even after a full championship taper, seemed counterintuitive at the time, especially for a sprinter. But it proved to be the right thing, as this swimmer ended up with a successful race and qualifying time to participate in the 2024 Olympics.
I don’t claim to have single-handedly solved their performance issues in the pool via clever velocity prescription or volume restriction. Still, there was a positive contribution from training the right qualities at the right time and allowing the body to focus on what it needs at the moment. The testing, re-testing, and categorizing of these values gave us valuable information that we could act on quickly to modify an individual program based on needs at the time of training.
Tweet ThisHe had begun to express fatigue in the kicking part of the 200-yard swim, we programmed 6-8 sets of 10 reps of a fast, anaerobic, recovery-focused lower or upper body. We focused on rebuilding the fatigue resistance of the underlying muscle tissue.
Alex Beljic
Programming details for 2-dimensional DSI work
Frequency and intensity of training is king. The human body is resistant to change, so consistent exposure to higher velocities or heavier training is important. If you’re training someone once or twice a week, chances are you won’t be able to make any significant changes without adequate volume.
Practitioners should target these properties in a developmental period of a phase where you know there will be uninterrupted training.
The profiling of a group changes significantly if the population you are testing is widely diverse in terms of body mass.
A 130 cm athlete who weighs 51 kg is completely different from one who is 185 cm and 105 kg. The two may have greatly different outputs. But the DSI quadrant method can use force relative to body mass. Expressed that way, those two athletes could both have a 51 N/kg CMJ peak force and a 120N/kg IBSq peak force, resulting in the same quadrant prescription.
Practitioners should consider the applicability of total vs. relative output to their context, which includes the demands of the sport and each athlete’s physical and physiological make-up.
Also note the DSI is for the lower extremity. We don’t know until we come up with analogous tests whether the same ratio of qualities is present in a given athlete’s upper body. The examples above were from swimmers, who showed some correlation with fast and explosive upper body movements. Those inclined to be “strong” or “powerful” on lower body testing had a higher bench press 3RM than the “twitchy” or “potential” athletes. Similarly, while testing women’s lacrosse players, I found a significant divergence between their upper and lower body strength to speed ratios.
Finally, never discount the athlete’s subjective experience and self-reports.
Ask them: What do you need? They will likely tell you that they need to get either faster or stronger. The DSI quadrant method can confirm the assumption that you, the coach, and the athlete probably already know.
Tweet ThisPractitioners should consider the applicability of total vs. relative output to their context, which includes the demands of the sport and each athlete’s physical and physiological make-up.
Alex Beljic