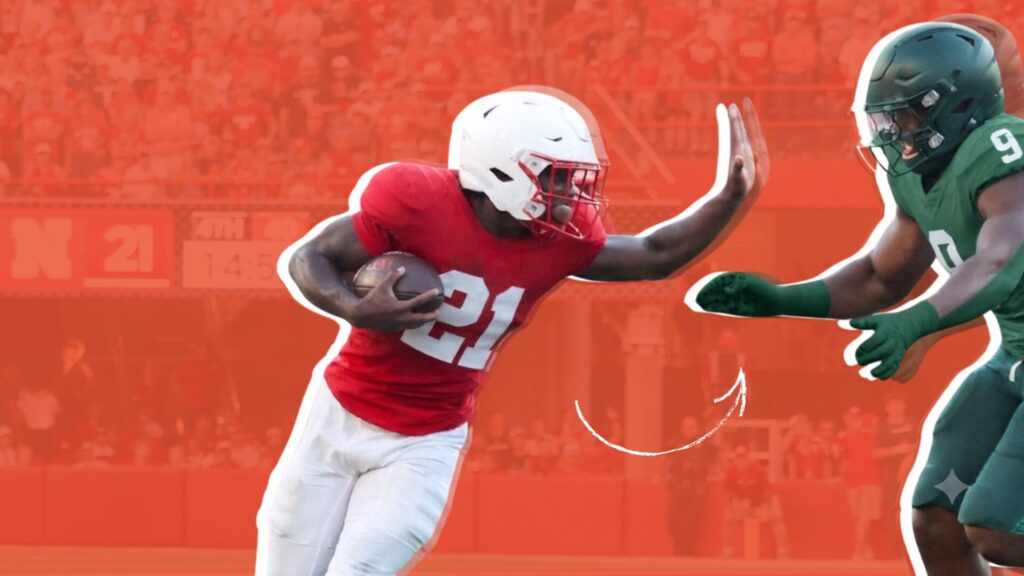


Ask any player or coach who has experience at the highest level of rugby, and they will undoubtedly discuss collisions. You will often hear things like “fronting up,” “winning the gain-line,” “gaining momentum,” “dominance,” “physicality,” and so on. There are obviously many factors—physical and psychological—that go into performing and succeeding at the highest level of rugby union, but collisions always dominate the conversation.
With seemingly everyone in our industry obsessing over distance and speed metrics, I want to shed some more light on collisions. Specifically, how coaches and backroom staff can integrate sports science information to help with planning training, recovery, and maybe even selection.
Tweet ThisThere are obviously many factors—physical and psychological—that go into performing and succeeding at the highest level of rugby union, but collisions always dominate the conversation.
@drpetertierney

Quantifying collisions in rugby union
Historically, performance analysts have been responsible for coding collisions in rugby. This is a reliable method of monitoring the number of collisions, and is also an important piece to understanding collision performance technically. Coaches and players reflecting on performance will assess factors such as body height, leg drive, and other technical details.
However, video coding collisions is highly time intensive and does not provide insight into the intensity of those collisions.
The same technology that provides metrics related to speed and distance can also provide collision metrics, which is a valuable add-on for monitoring in rugby union.
Before integrating collision based metrics, coaches and players may challenge the relevance of distance based metrics. Games used to be less intense from a running point of view for many positions, compared to a MD-1 session.
Two important rugby-specific metrics are the number of collisions and collision load, which sums the loads associated with all collision events and accounts for the magnitude and duration of these events. Our data from 2020 found nearly perfect alignment between the number of collisions coded by the expert video analysts and the output of the micro-sensory technology (MST) reporting collision count and collision load (Figures 1-2). [1]
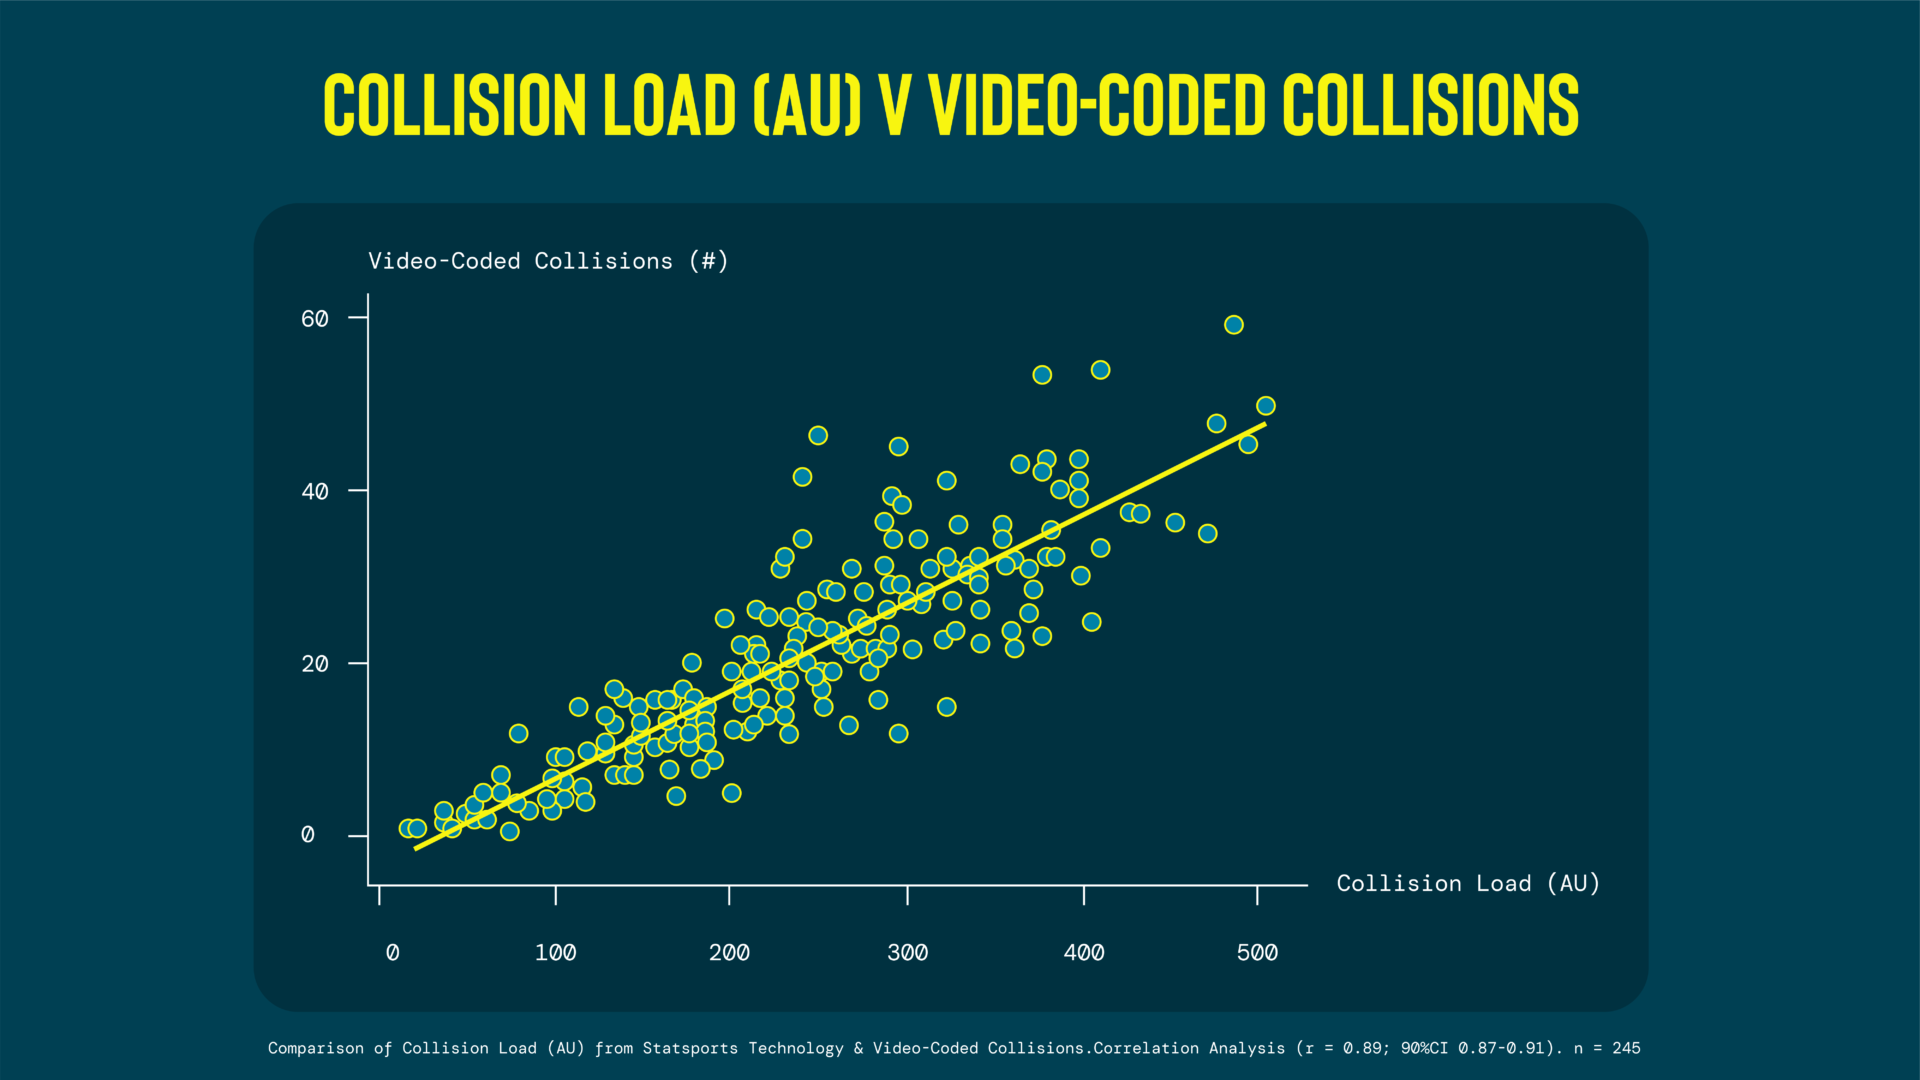

Tweet ThisTwo important rugby-specific metrics are the number of collisions and collision load, which sums the loads associated with all collision events and accounts for the magnitude and duration of these events.
@drpetertierney
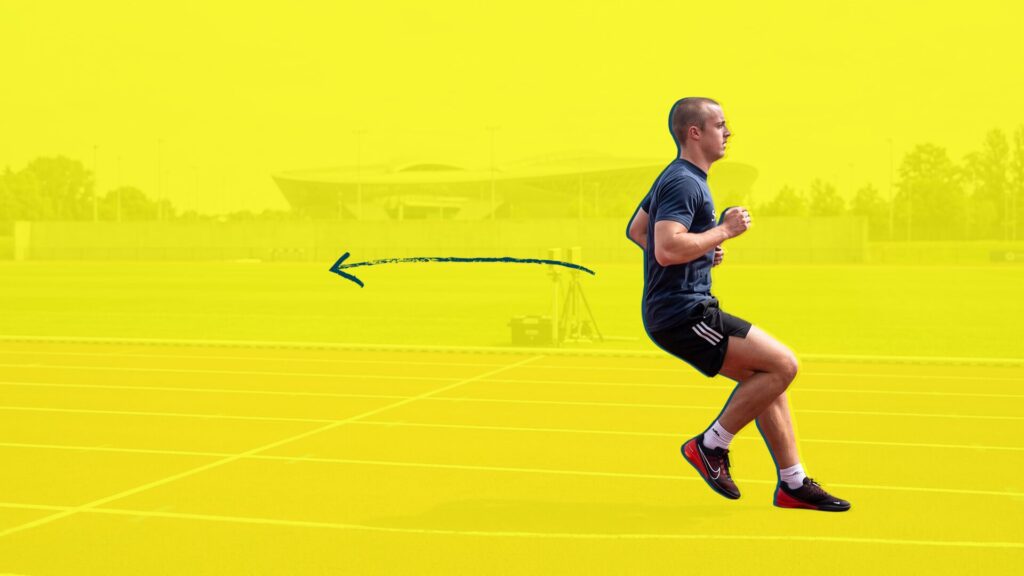
We also found differences in collision intensity (collision load per collision) between positions. Typically, backs experienced higher loads per collision than forwards. We attribute this to the higher velocity at which they enter collisions: running from a greater distance at a higher velocity will increase the impact of collisions (Figure 3). This is observable when watching games, but now we can validate that conclusion empirically.
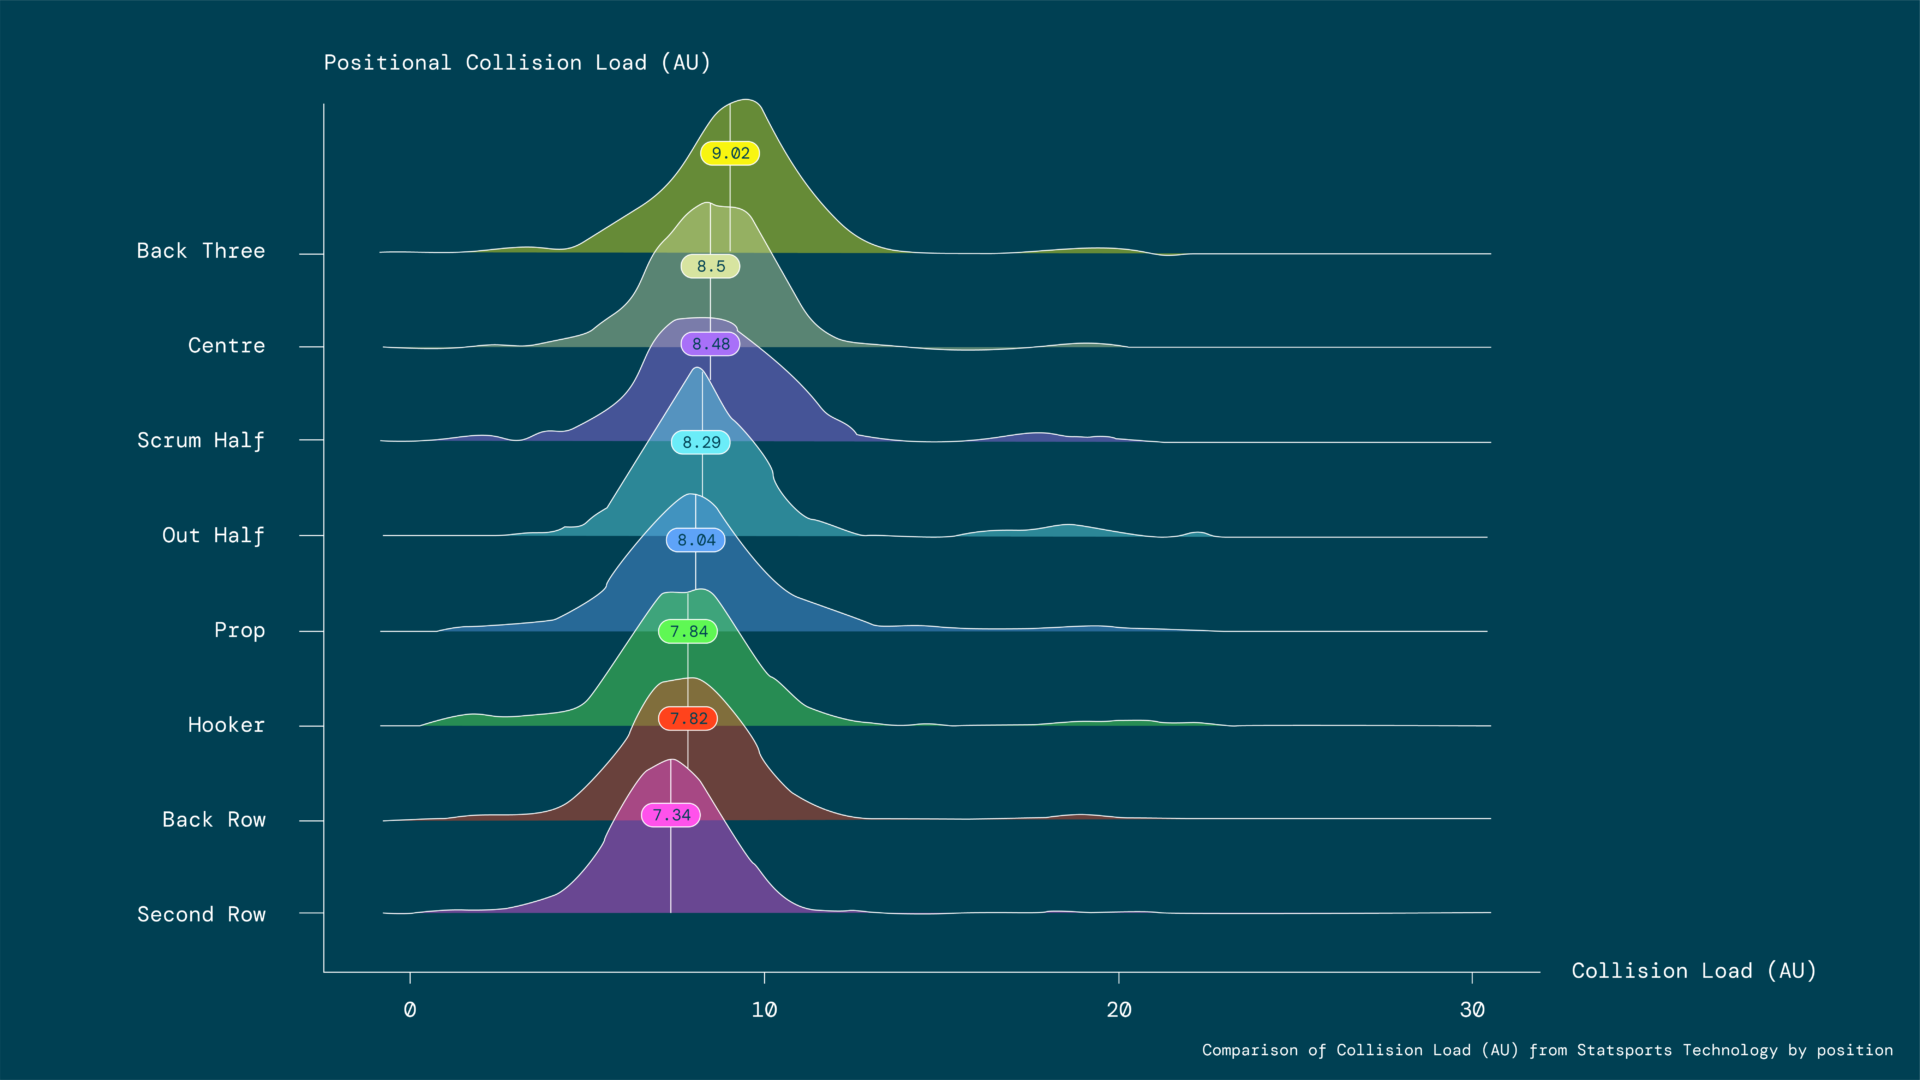
Tweet ThisTypically, backs experienced higher loads per collision than forwards. We attribute this to the higher velocity at which they enter collisions: running from a greater distance at a higher velocity will increase the impact of collisions.
@drpetertierney
How collision metrics vary with competition level
We wanted to get a sense what else we could learn from better understanding collisions. I spoke with players and rugby staff about the challenges of international and European rugby, and what they felt was different.
Time and time again, winning collisions and the intensity of collisions at the top level came up in conversation.
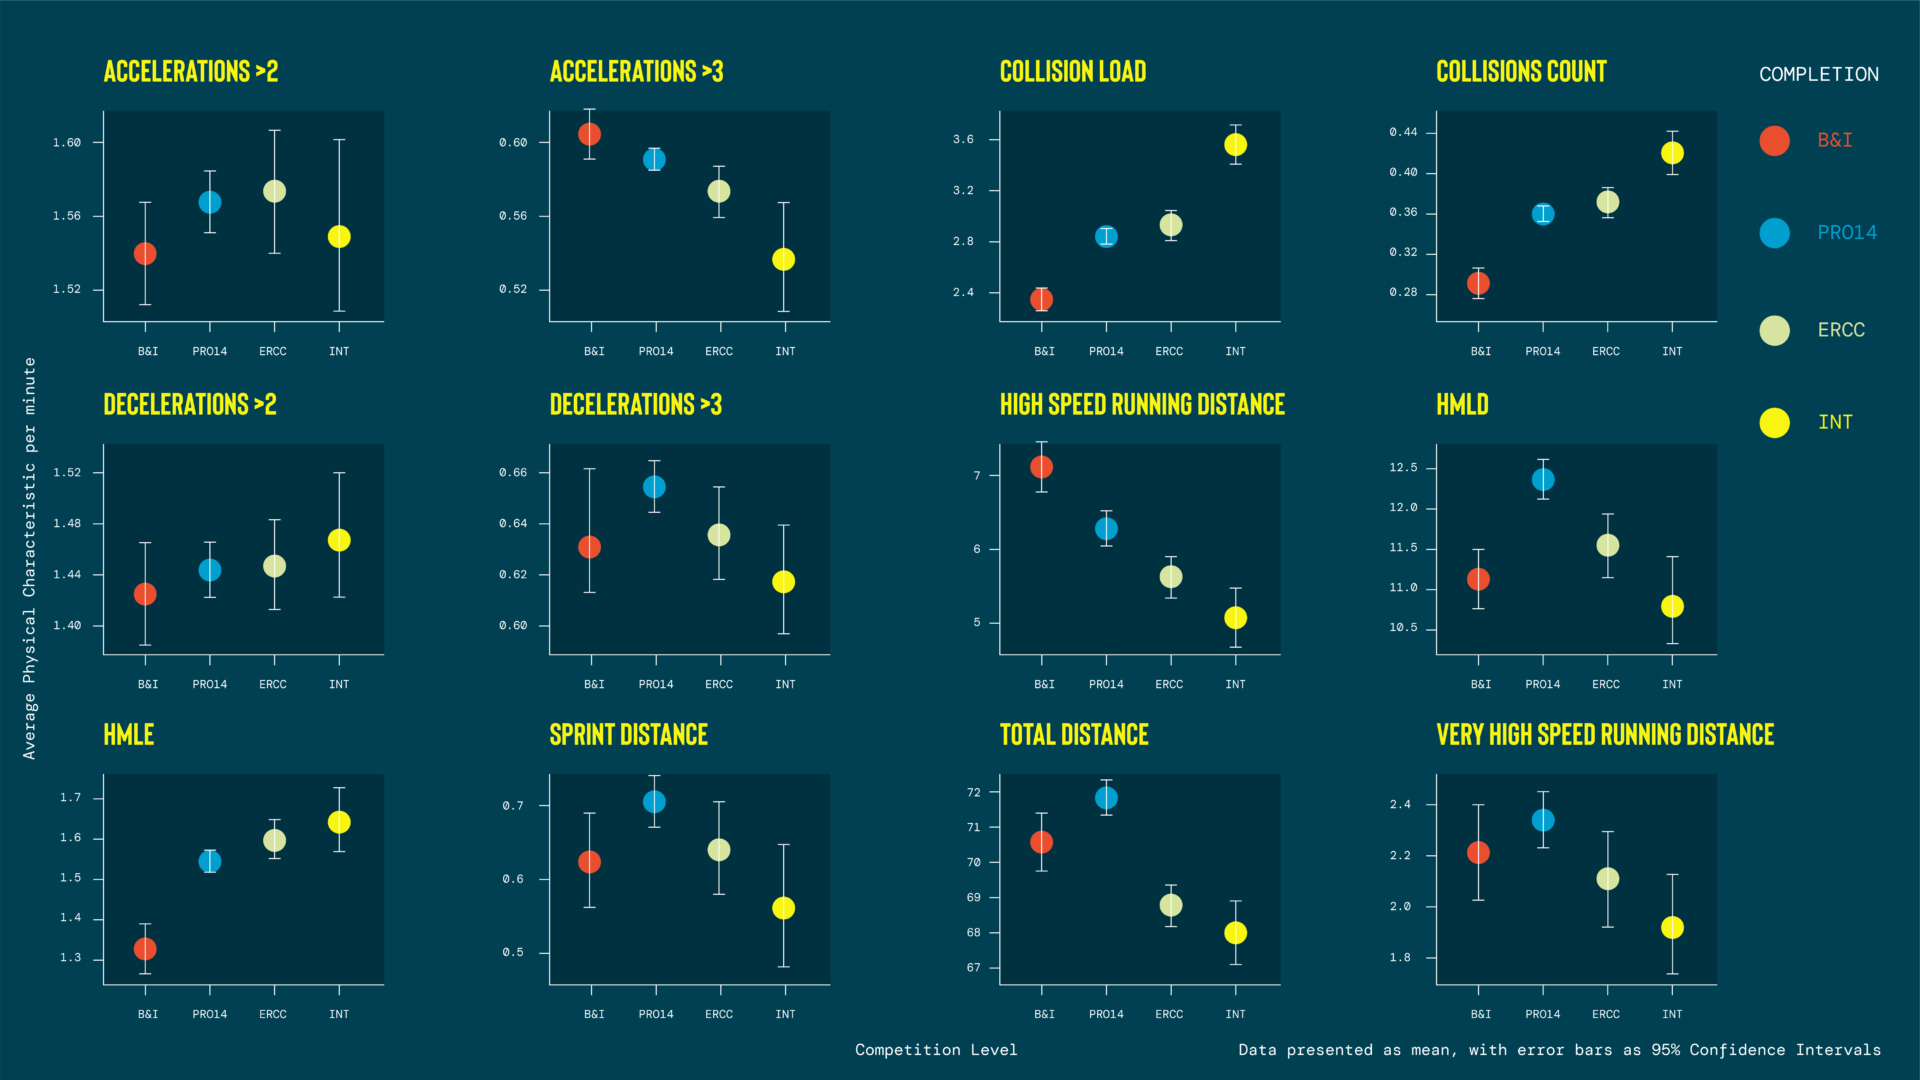
When we analysed the difference in intensities for 12 common MST metrics, we found some interesting trends. [2] Focusing on a few metrics brings two key observations into focus.
First, total distance and high speed running (HSR) distance intensity were lower in the highest levels of European and international competition compared to domestic match play. The narrative that the game is faster is likely not accurate from a running perspective.
Next, collision load, collision count, and collision intensity increased as the competition level increased, particularly at the international level.
Obviously, other metrics are still important, even if they do not show as large or meaningful differences.
Observers (casual watchers and those with trained eyes) of the tests on the tour note an increase in collision intensity, or physicality. That is also a regular bit of commentary in the week leading into the tests, and part of interviews from players after tests. Referring to Figure 4, I expect the Lions’ test matches against Australia to be similar to the international test fixtures in this data set.
Measuring the impact of collisions
Collisions can have a significant impact (!) on injury prevention and overall preparation, particularly during an intense tour schedule.
On one side, collisions and momentum (mass x velocity) are key determinants of success in rugby union. [6, 7] Players with higher momentum going into collisions were actually less likely to be injured in the tackle. From a coaching standpoint, if we encourage acceleration into contact, we should get the dual benefit of performance outcome (winning or dominating the collision) and also reducing injury risk.
On the other hand, contact events are often the most common cause of match injuries: 91.1% in college rugby and over 70% in elite level Japanese rugby, per recent studies.[4] We have already unfortunately seen a player’s tour end through a contact injury. [3]
And while some injuries just cannot be avoided, the authors of a recent systematic review concluded and suggested: “The frequency and intensity of collisions in training and matches may lead to adaptations for a ‘collision-fit’ player and lend itself to general training principles such as periodisation for optimum collision adaptation.” [5] This logic suggests that we can prepare players for collisions specifically by exposing them to collisions in training. We routinely incorporate the repeated bout effect for eccentric muscle training. There may be some applicability to collision / contact-induced muscle damage, with a resultant protective effect, too.
Plenty of data explores the association of training load, locomotor metrics such as sprint distance and high speed running distance, and injury risk. However, there is less data indicating how collisions could complement locomotor metrics to model players’ injury risk.
The best way to prepare rugby players and reduce injury risk must include some component of contact load tracking, alongside all the other pieces around recovery, strength, and fitness.
Tweet ThisWe can prepare players for collisions specifically by exposing them to collisions in training. There may be some applicability to collision / contact-induced muscle damage, with a resultant protective effect, too.
@drpetertierney

Accounting for the “cost” of contact
Collisions massively increase energy expenditure: including 20 collisions increased average energy demand by 1200 kcal. [8] That’s an enormous deficit to make up in a week packed with already high energy needs for repairing muscle after strength training, high running demand, travel, and everything in between. Now consider that elite rugby players can experience more than 60 collisions in one game.
For Lions players touring and potentially playing in two fixtures within a week, plus training in between the games, good nutrition and recovery are critical.
Understanding the demands of the tour
The Lions’ Tour this summer in Australia will likely look like a combination of a few levels from a physical point of view.
Since the Lions play both international fixtures (as test matches) and club fixtures, I expect the physical, psychological, and tactical characteristics of these games will differ. The coaching and performance support teams have the challenge of preparing a large squad with diverse training routines for multiple fixtures and training, mixed together with travel, socials, marketing demands, and everything else that the Lions Tour brings.
If you’re watching the Lions Tour, here are a few questions to consider. First, we may see a more free flowing style of play with a lot of running in the midweek games. Will coaches select players based on this expectation?
Next, expect test matches to have the highest contact intensity. Will the Lions coaching team select a more “physical” team to prepare and play for the test matches? If so, how will they determine this?
Third, the squad will have players who favour different styles of play: some more running based, others more contact based (in broad terms). How will the physical characteristics of the fixtures, but also of the players within the squad, influence selection and style of play?
Finally, nutrition and recovery will be key to success on Tour. How will the players who play both the midweek game and the test matches prepare and recover for the differing needs of competition?
Tweet ThisCollisions massively increase energy expenditure: including 20 collisions increased average energy demand by 1200 kcal. That’s an enormous deficit to make up in a week packed with already high energy needs for repairing muscle
@drpetertierney