The training load literature has become overwhelming. As I type “External Training Load” into Google Scholar, I’m awaiting more than 1.5 million hits to pop up. I click the first one, a commentary by Impellizzeri et al. [1] The authors highlight an important fact when they state “the concepts of external and internal load do not have a single or gold standard measure, but rather these may be quantified by a myriad of variables, which describe the external load or the internal response during the exercise.”
As many of you have probably noticed, external training load has been quantified in pretty much every sport, using seemingly every type of variable imaginable.
Staunton et al. [2] recently addressed the concept of multiple variables to quantify training load. The article, Misuse of the term ‘load’ in sport and exercise science, discussed how most training load variables do not measure load at all. Specifically, they point out that load is a measure of force, and therefore should be measured in the appropriate SI unit, Newtons. It doesn’t take much of a literature search to find out how many different variables have been used to quantify external training load in the past: distance travelled, speed, velocity, acceleration, deceleration, work, power. None of which are quantified in Newtons.
From an academic point of view, I see where the authors are coming from. Language matters in science, and it’s almost to the point where it’s impossible to compare training load measures between studies. This particular article is likely going to change the landscape around training load terminology in scientific publications. It has made a lot of buzz (good and bad) among sport scientists, strength & conditioning personnel, coaches, rehab practitioners and others.
On the other hand, I see why practitioners and sport scientists alike will continue to use many different variables to quantify training load. Scroll Twitter for a few minutes and you will quickly see why the language will likely stay the same in many cases. And I can’t disagree with the familiar argument of “if the coach understands what you are talking about, why change?”
The bigger danger is that confusing terminology may further muddy the waters in sport science. Confusing terminology is not new in sport science, or sport performance, or strength & conditioning, or…. well, just read this article by Martin Bucheit and Dave Carolan. They creatively highlight the copious variations of job titles thrown around in sport organizations nowadays. What’s the difference between “Head of Performance” and “Director of Performance,” exactly? More terminology likely leads to more confusion about roles, bites into the organization’s productivity and may lead to the staff working at cross-purposes in silos…

Training load and the determinants of sport performance
Verbiage aside, let’s ask why the majority of external training load variables are measured in linear planes, despite most sport movements being rotational.
Aaron Coutts stated the importance of relating the measurement of training load to the determinants of performance in a recent Sportsmith Live. He said the number one way to do this is to watch the sport to find the metrics that matter. He may have landed on a reason why so many variables are being used to measure training load in the scientific literature. Furthermore, another takeaway from that discussion was that there is no workload metric that works for all sports. Distance travelled will likely not help a javelin thrower, but a measure of performance, like trunk or arm angular velocity, will. [3]
We should keep the demands of an athlete’s sport in mind when preparing the athlete to perform optimally.
So why isn’t that the case when measuring external training load? It is difficult to think of a sport technique that doesn’t have both linear and rotational components to it, yet very few published training load variables address the rotational component.
Tweet ThisIt is difficult to think of a sport technique that doesn’t have both linear and rotational components to it, yet very few published training load variables address the rotational component
@goreham87

Dissecting sporting movements to find the variables that matter
Say you want to quantify training load using a variable that encompasses important sport‑specific performance parameters. Where do you start?
A common method would be quantifying success in the sport. Usually this includes creating a deterministic model outlining a movement outcome measure or key performance indicator (KPI), and the relationships with the biomechanical parameters that produce it [4]. Sports biomechanics has used deterministic models heavily for many decades. Despite some downfalls, they give a broad view of what is needed for success in a sport [6].
Let’s use artistic gymnastics as an example. Since artistic gymnastics is a points-based sport, coaches create routines that will award their athletes the most points. As shown in the figure below, points derive from biomechanical parameters in the second layer of the deterministic model [7]. For the vault, these would include the trajectory of the body’s center of gravity, angular distance and form. The third layer of biomechanical parameters shows what determines the second layer of biomechanical parameters, and so on. For angular distance, the model shows angular momentum at takeoff, the average moment of inertia and flight time being important variables.
An important feature in gymnastics is angular momentum. The moment of inertia and the angular velocity of the gymnast determine angular momentum [8]. During flight, the angular momentum will stay constant, but the angular motion can change. One way to change the angular motion of the gymnast in the air would be to decrease the distance between the axis of rotation and their centre of mass, i.e., their moment of inertia. This change in body position will change the gymnast’s angular velocity, which we can measure.

Figure 1. Adapted from Takei et al. [7]
Interestingly, the common resultant acceleration approach has been used to measure training load in artistic gymnastics before [9]. An accelerometer near the athlete’s center of mass collected triaxial accelerations during training and competitive routines. To analyze these data, you simply square the accelerations in the x, y, and z planes, add them together, and then take the square root of that sum [9]. This value may give a proxy for the overall training load on the athlete. But as you can see in the deterministic model above, increased three-dimensional accelerations acting on the body is not directly related to performance.
Again, in a lot of sports, training load variables are not related to performance – they simply quantify overall load on the athlete.
Tweet ThisIn a lot of sports, training load variables are not related to performance – they simply quantify overall load on the athlete
@goreham87
We could take a huge leap towards increasing success in sport by not only ensuring an athlete stays healthy, but by simultaneously tracking some important performance parameters as well.
For the vault in artistic gymnastics, we’ve identified how the rotational portion of the movements are extremely important to completing complex routines. Why not measure that, too?
We already use everything we need
“It’s too difficult to measure the rotational aspect of the movement” should not be the reason for the lack of rotational data in the training load literature. The majority of sensors on the market today for sports practitioners to measure external training load include an inertial measurement unit (IMU), which, in addition to an accelerometer and other sensors, also includes a gyroscope.
As a refresher, an accelerometer measures linear accelerations (g), whereas a gyroscope measures angular velocity in degrees per second (°/s). The locus of both outputs is in or around the IMU’s three orthogonal axes (i.e., x, y, z), and each have their own measurement specifications, which largely depend on their intended use. The majority of accelerometers in sports can measure low (±2 g) or very high (i.e. >200 g) magnitudes of acceleration. The full standard range of gyroscopes, on the other hand, can measure angular velocities of thousands of degrees per second. The Xsens DOT’s accelerometer (pictured below) has a full standard range of ±16 g, whereas its gyroscope has a full standard range of 2000°/s.

Figure 2. Xsens DOT’s accelerometer
Chambers et al. [11] gives many examples of using gyroscopes to quantify sport-specific movements. Although the purpose of their article was not to relate these data to external training load, their findings give insight to which movements we can track for training load monitoring. If we relate this back to the artistic gymnastics example, we can see how gyroscope- and accelerometer-derived data differ on an athlete completing a vault routine. The panels on the left show the raw triaxial accelerometer and gyroscope data, whereas the panels on the right show the accelerometer- and gyroscope-derived training loads. At the end of the day, there’s not much difference between the two datasets, aside from one being more related to performance than the other.

Figure 3. Artistic gymnastics examples
Setting performance targets from training load data
We commonly think of external training load as how close we can get an athlete to a red line before they cross it and become injured. With the quality of technology we now have access to, it may be time to push these boundaries forward a bit.
As a performance analyst who works with a few different National Sport Organizations in Canada, I am asked almost daily about ways we can use technology to answer a performance‑related question. Like Aaron Coutts, as I referenced above, I believe training load should be linked to the sport’s KPIs. We have a great opportunity for integrated support team members to not only monitor training load, but to measure important variables related to performance as well.
Sometimes I wonder how much performance would change if training load data was not the exclusive preserve of strength & conditioning coaches and sport scientists trying to understand the load the athlete should complete in the gym that day. What if the coach and sport biomechanist used these data to understand how close the athlete is to reaching a target benchmark necessary to complete a sport skill successfully?
Tweet ThisSometimes I wonder how much performance would change if training load data was not the exclusive preserve of S&C coaches and sport scientists trying to understand the load the athlete should complete in the gym that day
@goreham87
For example, we should not be content just to estimate the angular velocity Simone Biles needs to reach off the vault when completing her signature move. Now that we can easily measure it, we should do so in order to see how close she is to obtaining the goal.
More importantly, if an athlete is off or “not there yet” from a technical standpoint, we can then turn our focus to measuring the progression of the technique over time. At the end of the day, the sensors are already collecting this data. Why shouldn’t staff members come together to measure performance as well?

Figure 4. Raw gyroscope data with target benchmark
Preventing injury and enhancing performance
Another sport-specific example of merging the injury prevention and performance enhancement approaches is external training load monitoring in professional baseball.
Oblique injuries are relatively common in the sport due to the sheer amount of powerful rotational movements athletes perform day in and day out for most of the year. To make matters worse, players can injure their obliques in pretty much all aspects of the game. A recent article by Camp et al. [12] found approximately 1000 professional baseball players endured an oblique injury between the 2011 and 2015 seasons.
More came from the batting motion (46%) than any other cause. This makes sense, because a day in the life of a professional baseball hitter includes a ton of swings. They spend time taking cuts off the tee, hitting flips and taking live pitching in the cages, completing on-field batting practice, all on top of the number of forceful cuts they take during the actual game. With 162‑games in the MLB season, it is important not to overwork the athletes leading into the playoffs.
The gyroscope is the perfect tool for quantifying the intensity of the swings, along with the more common measures of the frequency and volume of swings.
If an oblique injury pops up, a therapist will need to manage the load to ensure the player is on the right track to return to the lineup, and that they are not completing their rehab at too high of an intensity, which could cause another setback.
For example, we may want to ensure the player is swinging with submaximal efforts. The following figure shows a player’s trunk angular velocity in the longitudinal plane during three consecutive swings. These data came from an IMU embedded in the player’s heart rate monitor and are non-filtered.
The first swing is low intensity, the second is medium intensity, and the third is an all‑out swing‑for‑the‑fences intensity. The gyroscope can detect the increasing swing intensity quite well, as peak angular velocity increases approximately 100°/s with each consecutive swing.
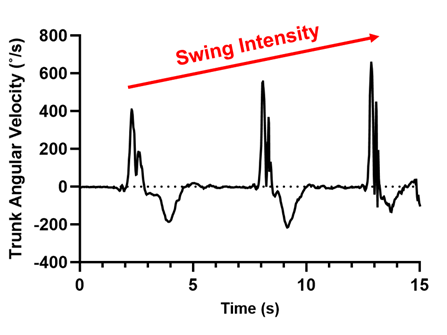
Figure 5. Trunk angular velocity in the longitudinal plane during three consecutive swings
Once the athlete is back to 100% health, we can use the same data to measure performance.
Batters are now chasing down a metric – exit velocity – that quantifies the speed of the ball as it leaves the bat. Exit velocity correlates well with many offensive statistics in baseball. If we dissect exit velocity using a deterministic model, we will determine that the angular velocity of segments moving along the kinetic chain influence exit velocity [13]. Again, body segment angular velocity is something we can measure with a gyroscope on basically any part of the body or equipment. If we are already collecting the data, why not relate it to performance?
Know the specs before putting a sensor on an athlete
Before we all run off and start collecting rotational data with our athletes (not that I am trying to convince you of that), there are a few important signal analysis concepts to consider.
I don’t need to reiterate the importance of checking the device’s validity, reliability, and sensitivity because Jo Clubb already did this at length in a recent Sportsmith article. She is absolutely correct that we can’t take these concepts for granted, not with new technology popping up on the market everyday with, it seems, endless false promises.
Tweet ThisWe can’t take validity and reliability for granted, not with new technology popping up on the market everyday with, it seems, endless false promises
@goreham87
Before collecting data we also need to ensure the gyroscope can actually measure the magnitude of the movement being tested. For example, a tennis player rotating their arm at a peak angular velocity of 2900°/s should be equipped with a gyroscope that has a full standard range of at least 3000-4000°/s to ensure the device can capture the full movement.
Furthermore, as technology has developed, the sampling rate of wearable sensors has continued to grow. Movement frequencies are important when analyzing both linear and rotational movements. Identifying an appropriate sampling frequency is crucial to ensure the IMU’s signals do not omit critical features of the movement. Nyquist’s sampling theorem, which states that the minimal sampling rate of a signal must be at least two times greater than the maximum frequency found within the signal, can help avoid missing data [14].
Finally, before opening the wallet to pay for these devices, make sure to always check the sensor’s data sheet to ensure it can measure what you think it can measure! An example of a data sheet from the Xsens DOT’s user manual is shown below.
| Gyroscope | Unit | Value |
| Standard full range | [%] | ± 2000 |
| Sensitivity | [LSB/g] | 16.4 |
| In-run bias stability | [°/h] | 10 |
| Bandwidth (-3dB) | [Hz] | 255 |
| Output noise density | [°/s/VHz] | 0.007 |
| g-sensitivity | [°/s/g] | 0.1 |
| Nonlinearity | [%FS] | 0.1 |
| Scale factor variation | [%] | 0.5 (typical_ 1.5 (over life) |
| Sample frequency | [Hz] | 800 |
| Resolution | [bit] | 16 |
Table 1. Gyroscope specification
| Accelerometer | Unit | Value |
| Standard full range | [g] | ± 16 |
| Sensitivity | [LSB/g] | 2048 |
| In-run bias stability | [mg] | 0.03 |
| Bandwidth (-3dB) | [Hz] | 224 (Z axis: 262) |
| Output noise density | [µg/√Hz] | 120 |
| Nonlinearity | [%FS] | ± 0.5 |
| Sample frequency | [Hz] | 800 |
| Resolution | [bit] | 16 |
Table 2. Accelerometer specifications
Practical takeaways for enhanced load monitoring
- Be cognizant of your language, not only in the scientific literature, but in the daily training environment as well.
- Ensure training load variables are related to your sport’s determinants of performance. Use a deterministic model to check this if needed!
- Collaboration amongst the integrated support team and coaches should provide the most impact on performance. Team up to ensure important data are not wasted.
- Double check the information in the data sheets of the equipment you are currently using. Are the metrics measuring what you think they are measuring? Is there another device on the market that can give you better quality data?