Recent literature presents contradictory evidence of overall injury incidence in elite professional football (soccer) over the last decade, with some studies showing an increase and others showing a decline. [1,3]. However, a consensus seems to exist that muscle injuries remain as disruptive today as in previous years. The full potential of the data collected in professional football has not yet been fulfilled – the available data sets require more exploration before they can yield their value. Possible explanations for the gap between potential and realised value could be the high degree of siloed analysis on small subsections of data, small datasets, varied human operator skill and, at times, the heavy manual nature of the work, which contributes to data fatigue (see Figure 1). As a result, some industry professionals consider interpreting workload data for injury risk mitigation purposes to be a fool’s gold [4,5].

Artificial Intelligence (AI) is already displaying incredible capability, from reducing the catastrophic impact of natural disasters to making online shopping more intuitive [11]. For many of its use cases, AI can add quantifiable insights that complement the human decision-making processes for beneficial outcomes. This is particularly visible in medical diagnostics and radiological analysis where AI assists in the detection of a vast array of medical conditions and offers prognostic suggestions [12].
Tweet This“AI can add quantifiable insights that complement the human decision-making processes for beneficial outcomes”
@Zone7ai
AI research is now turning to injury risk mitigation in sport. Zone7’s AI-driven system offers daily injury risk forecasting based on available datasets. It is currently deployed at professional sports organisations to allow practitioners to make decisions and take action from a fully data informed perspective. Zone7 anchored its work on key principles of data analysis, setting the following requirements for its system:
- Must absorb the large available datasets in an unbiased fashion and in an automated manner, where possible.
- Be technology-agnostic and reliably transform workload, injury history and other data from multiple trusted sources into a robust multi-team data lake.
- Reflect the environmental needs of the organisations’ and individual user’s attitude towards risk.
- Perform data analysis efficiently with an understanding that injury risk forecasting is multifactorial.
- Dynamically adapt and learn over time to improve injury risk forecast accuracy as variables change and more data is collected, meaning the system’s sensitivity and specificity are expected to improve.
- Appropriately translate data trends and clearly communicate actionable insights for the human end-users to contextualise and apply as deemed appropriate.
The Zone7 AI system conducts complex computation of big data efficiently and consistently, for meaningful insights, every day. Its ability to perform these functions reliably in real-time eases the data analysis workload and has the chance to make a significant, if not yet fully tapped, contribution to how MDT professionals manage and minimise injury risks in professional athletes.

11 Team retrospective meta-analysis case study examining Zone7’s capability to accurately forecast injury risk
We performed a retrospective analysis of workload data and injury incidence from 11 professional football (soccer) teams competing in Europe and North America. We had data for each team from at least one competitive season between 2019 and 2021. While the study was not intended nor designed to serve as peer reviewed scientific research, our goal was to add a degree of evidence-based information to the discussion on how AI can potentially assist in MDT player-management processes to mitigate injury risk in professional football.
The primary focus was to demonstrate Zone7’s ability to accurately forecast increased injury risk, using actual injury incidence as the point of comparison. We also wanted to assess how accurately Zone7 forecasts injury type, alongside the system’s precision and usability, as reflected by the number of players identified as being at risk on a daily basis.

Methodology
The Zone7 system took in the workload data and forecasted each individual player’s injury risk every day. That is, the system would estimate on each day each player’s likelihood to sustain an injury in the upcoming seven days. If a player was forecasted at an increased risk, the system categorized it as high or medium risk, reflecting the probability level the system estimated of the injury occurring within the upcoming seven days
We then cross-referenced these forecasts against the actual injuries each team’s outfield players sustained. The AI system had to estimate increased injury risk – an estimated likelihood above a certain threshold – 1-7 days prior to an injury that actually occurred for us to meet our criteria for a successful forecast. Cases of increased injury risk were categorised as high or medium.
Across the 11 teams, Zone7 had 423 injuries to cross-reference against the workload data, a sufficient amount to ensure robust findings.
Each team’s workload dataset came from the different sources and technology providers they each use. Consequently, we created a specific predictive model for each team based on the unique combination of workload parameters in their dataset. While the Zone7 system was flexible enough to be technology agnostic, the metrics from each teams’ data-generating devices typically contained the full set of external load metrics. When it was consistently available, heart rate data was the internal training load metric. If no workload load data was available for an individual player – perhaps because of device malfunction or international team commitments – we simulated the data based on minutes played in case of a match or microcycle analysis in case of a training session. This data simulation was performed using industry-standard mathematical methods for data imputation.
Despite the variance in external and internal training load parameters from the different clubs, the analysis was built upon the same methodologies for all, with proper mathematical methods to account for such differences.
Beyond workload data, each player’s historical injury record and age were used as inputs, alongside each team’s competition schedule. This helped complete the picture of each team’s periodised microcycles along with seasonal trends.
We took the following steps to address any potential bias in the analysis:
- All injuries sustained and fed into the system were sustained in-season through direct training or match participation, including during preseason. The analysis excluded goalkeeper injuries, non-sport injuries, illnesses and off-season injuries.
- Four weeks was the definitive timeframe to establish initial relative benchmarks for each player. Therefore, some in-season injuries were omitted from the analysis if less than four consecutive weeks of data for the player involved was available.
- Zone7 performed the workload analysis and generated injury risk forecasts before taking in the actual injuryincidence from the period under analysis.
- Zone7’s AI algorithms were not trained on any of the clubs’ data before performing this analysis. That is, all results came from out-of-sample testing.
Injury detection rate
Across the 11 teams in the analysis, the players combined for 423 injuries. Zone7 forecasted increased injury risk one to seven days prior to the occurrence of 306 of these injuries. That means, if Zone7 had been deployed and in use real-time, the teams would have been alerted to a player’s increased risk of injury 72.4% of the time that an injury actually occurred. 56.1% of those alerts would have been categorised as high risk and 16.3% as medium risk.
Put another way, when taking into account the severity of the injuries included in the analysis, the injuries that Zone7 forecasted as high/medium risk events accounted for 65.4% of the man-days lost.
Tweet ThisWhen taking into account the severity of the injuries included in the analysis, the injuries that Zone7 forecasted as high/medium risk events accounted for 65.4% of the man-days lost
@zone7ai

Presenting injury risk levels as high or medium offers an immediate signal of the probability of sustaining an injury in the upcoming seven days, as estimated by the Zone7 system. This risk categorisation potentially allows MDT staff to prioritise and further individualise programming and training as part of the day-to-day player management processes.
While there was some variance in the extent of injuries correlated to increased injury risk forecasts on a team or league basis (the standard deviation in the injury detection rates between leagues was 4%), the Zone7 system performed consistently across different environments. Such results should provide confidence in the ability to apply the system and its methodology to different, new environments in the future.
A league-by-league representation of high or medium injury risk detection rates are displayed in Figure 4.

The predominant specific injury type was hamstring injury, followed by knee, ankle, calf, adductor, quadriceps and foot injuries. (Figure 5). Within the “Other” injury type category, the clubs classified 33 injuries as thigh injuries. This injury-recording issue means hamstring, quadriceps and adductor injuries would comprise even larger proportions if thigh injuries were classified with more specificity.
This information reflects the similarity between the data we used and the typical distribution of injuries by body part shown in academic studies that examined the epidemiology of injuries in professional soccer [17].

Days lost by injury type reflect the severity of injuries associated with each body part. Over a quarter of the days out were due to knee injuries (Figure 6).

Results: Forecast accuracy by injury type
We incorporated an injury-type forecasting algorithm for nine of the 11 teams included in this case study. This algorithm indicated the three body parts (lower body only) most likely to sustain an injury every time the system forecast an increased injury risk (Figure 7) and the likely severity of such a potential injury in terms of days lost.
When examining the system’s injury forecast accuracy by injured body part , we see it doesn’t necessarily go hand-in-hand with how common each injury type is in the dataset. We did find that the two body parts the system performs best on, hamstrings and adductors , are normally linked with a non-contact soft tissue mechanism. The two injury types with the lowest forecast accuracy, foot and lower leg, are more frequently the result of a contact injury mechanism.
For injuries correlated with increased risk forecasts, the platform performed better at forecasting the injury type for quadriceps injuries and ankle injuries.
Importantly, unlike the results presented up to this section, this analysis is limited due to the sample size available per injury type; and these trends are observational and not statistically significant.

Results: Daily number of players at risk
To illustrate the usability of Zone7’s risk forecasts and indirectly reflect its precision levels, we highlight the daily number of players classified as high or medium risk per day. We find this metric best illustrates the system’s practicality, as it points to whether the modifications the system suggests are legitimately applicable within the reality of an elite football team environment.
By forecasting injury risk for the next seven days, the Zone7 system creates risk sequences of multiple days.
The number of players flagged as at-risk per day is an important criterion to demonstrate the advantages of Zone7’s output compared to standard precision metrics.
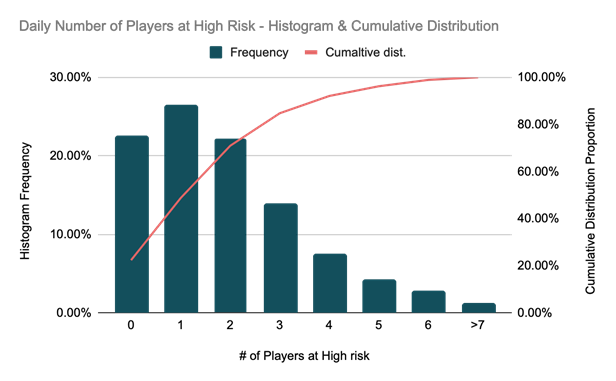
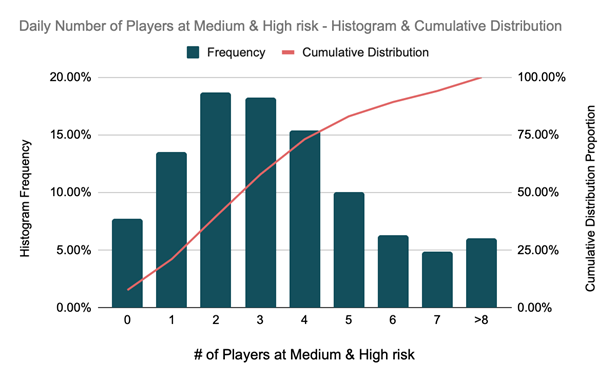
Figure 8 shows the distribution of the number of players across the case study labelled as high risk of injury, while Figure 9 shows the distribution of the number of at-risk (Medium and High) players throughout the full time span of this analysis..
On 80% of the all days across which this review took place, no more than three players were classified as “high risk.” This increases to four players per day on 75% of days under review when we include medium-risk alerts.
Qualitative feedback from members of each participating club’s MDT confirmed that these levels of daily high-risk injury alerts were manageable in terms of applying appropriate interventions to ensure players continued to remain available for training and competitive matches.
Results: Risk level seasonality
Normally, pre-COVID-19, the schedules in both European winter leagues and North America’s Major League Soccer (MLS) had repetitive seasonality, which had a significant impact on injury risk. During the 2019/20 and 2020/21 seasons, of which this analysis mostly consists, schedules were highly affected by COVID-19-related restrictions and their implications. Therefore, some of the seasonal trends weren’t as noticeable as in previous seasons.
In the European leagues, injury risk typically spikes around the autumn international breaks. Specifically in the English leagues, a spike is tyoically observed around the festive period when fixture congestion is prevalent.
The usual seasonality in the MLS is for injury risk spikes during the first three weeks of the regular season, during the end of May/beginning of June, and again in August.
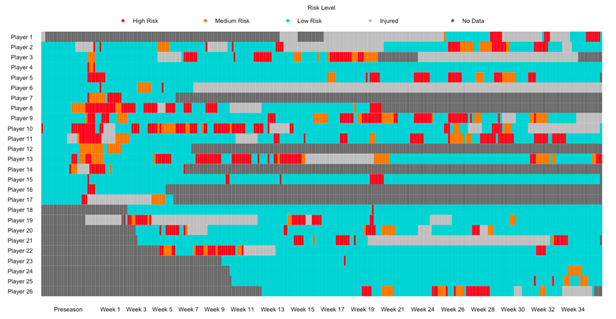
Figure 10 is a heatmap over players’ individual daily risk levels across one team over a single season. The heatmap reflects the different metrics and concepts discussed in this section, such as the daily number of players at risk; risk sequences and their varying length; and seasonal trends of injury risk at the team level.
Importantly, the system’s performance does somewhat vary throughout the season and is affected to an extent by seasonal trends. However, this chart shows that the system is sensitive to injury incidents throughout the entire season, implying that its ability to accurately forecast injuries in advance originates from further information and not just seasonal trends alone.
Forecasting the future of AI for injury prevention and risk mitigation
Despite such systems and practices being in their infancy, Zone7 displayed a sensitivity rate of nearly 75% when forecasting injury risk. That is significant and, when compared against the usability metrics presented above, suggests there is real benefit in exploring AI’s current and future potential in this context.
Considering football injury epidemiology, AI’s capability for perpetual self-improvement and the impact each injury type has on days lost, AI for injury risk forecasting and reduction in injury rates is worth continued examination.
However, simply identifying athletes at risk is not enough on its own to reduce overall injury incidence among professional athletes. Data-driven risk forecasts need to be linked to proactive and appropriate intervention strategies to achieve the outcomes the industry craves. Moreover, for MDT’s to use AI for injury risk forecasting responsibly, risk forecasts should be calibrated with additional layers of contextual information. The ultimate aims are to increase understanding as to why an athlete is at risk and increase psychological certainty around how best to optimize performance and minimise injury risk.
Football comes with an inherent risk of injury and regular performance requirements, meaning there is a fine balance between being risk-aware and risk-averse.
AI systems must acknowledge the need for harmony between risk of injury and performance requirements. They cannot be a distraction with too many false positives that potentially disrupt training routines and match preparation. Conversely, they cannot allow false negatives to overshadow the risk of potentially catastrophic injury.
Zone7 allows the end user to calibrate the sensitivity of the injury risk forecasts,.This lets the user “personalise” the false positive and false negative conundrum by reflecting the organisation’s attitude to risk in relation to athlete management.
This study showed the validity of AI in a retrospective context. If a team applies it in real-time as part of their day-to-day assessment processes, they will have to decide how to respond to the system’s output. If they take action based on an increased risk of injury for a given player and the player avoids injury, they will be left asking: did we help him avoid injury, or would he have stayed healthy even without our intervention? That application of the precautionary principle will affect the conversations around the utility and sensitivity of AI systems, and will require examining different metrics on top or instead of the ones presented here. Once acting on such forecasts, it may be better to assess actual injury rates as a main success metric, since some of the injury risks the system would have forecast are, in essence, being proactively prevented, therefore decreasing sensitivity.
The potential positive impact of applying an AI injury forecasting system such as Zone7 could be hugely significant across sports. Data is already influencing the broad trends we already see in professional football. AI has yet to fully establish its place at the table when it comes to mitigating injury risk. We believe it will only be a matter of time.