No one is a bigger proponent of standardized, repeatable neuromuscular assessments than me. However, practitioners should have an in situ model to provide context to what they are seeing in a controlled environment.
Think of the old adage of wild tigers vs. caged tigers. When you throw a steak at a tiger in the zoo, they are going to respond completely differently than if they were hunting gazelles in the jungle. We see the same thing in sports performance. After testing a myriad of different athletes over multiple years, I’ve found that sometimes the most aggressive and dominant athletes in a controlled environment can be the most docile of house cats on the field of competition, and vice versa.
As a young coach, I had the opportunity to work with a group of sprinters preparing for the World Championships. Being a novice in the world of speed and power at the time, I knew I had to seek the guidance of someone more experienced: Boo Schexnayder, coach of multiple Olympians and World Champions. Schexnayder came on site to consult on what we were doing.
I had tons of longitudinal data from force plate jumps and velocities from Tendo units, and was eager to “impress” Coach Boo with how we modulated programming based on this data.
Unfortunately, once he arrived and observed training, the topics of conversation had nothing to do with force-time curves, power outputs or squat velocity. His questions were primarily around setup in the blocks, projection angles and front side mechanics. Embarrassingly enough, I had no answers to these questions. That’s when it hit me. How am I going to train these athletes if I have no clue of the demands they face in competition?
Coach Boo was absolutely right. By examining only countermovement jumps and Tendo velocities, I was evaluating these sprinters as if they were caged tigers, not the wild tigers on the back stretch of the 200-meters traveling at 11 m/s producing forces up to 7x body weight.
Exploring the in-game physical demands of basketball
Working primarily in basketball, I approached this wild vs. caged question with a deep investigation of the physical attributes of elite basketball. This started with a systematic review of all available data to determine what a game activity profile consists of at the top levels of the sport.
We determined that the top basketball players across the world cover the least amount of distance during competition, but they do so at greater peak speeds and distance at high speed. We concluded, then, that elite basketball players are more economical relative to the tactical aspects of the game, while also possessing the greatest bandwidth to deliver that economy at the highest speeds.
Tweet This“We determined that the top basketball players across the world cover the least amount of distance during competition, but they do so at greater peak speeds and distance at high speed”
Adam Petway
Total distance covered during competition
Elite players have greater peak speed and cover less total distance.
- Elite – 4368m
- Sub-elite – 5377m
- Youth – 7558m
Average speed – NBA all-stars vs non-all-stars
- NBA all-stars vs non-all-star
- NBA non-all-star average speed
- Offence: 4.50 ± 0.28 mph (2.0 ± 0.1 m·s-1 )
- Defence: 3.86 ± 0.20 mph (1.7 ± 0.1 m·s-1 )
- NBA all-star players average speed
- Offence: 4.38 ± 0.36 mph (2.0 ± 0.2 m·s-1 )
- Defence: 3.65 ± 0.16 mph (1.6 ± 0.1 m·s-1 )
- NBA non-all-star average speed
Peak speed – elite vs sub-elite
- Elite peak speed – 8.09 m·s-1 top speed by NBA
- Sub-elite peak speed – 6.2 m·s-1 average top speed in sub-elite Spanish basketball
Elite vs sub-elite running exposures
- Elite backcourt – Frequency of running exposures – 504 ± 38
- Elite frontcourt – Frequency of running exposures – 513 ± 26
- Sub-elite backcourt – Frequency of running exposures – 321 ± 75
- Sub-elite frontcourt – Frequency of running exposures – 352 ± 25
High intensity actions – Italian 1st vs 2nd division
- Italian 1st division – frequency of exposures to high-intensity actions (HIA) of 107 ± 26
- Italian 2nd division – frequency of exposures to high-intensity actions (HIA) of 78 ± 35
Creating a mechanical model based on in-game evaluation
After determining the characteristics of in-game demands in basketball, we then had to understand what the top performers were doing in technical situations.
We dissected game film using a two-dimensional modeling software and created a database of the game’s top movers in both offensive and defensive situations.
Ultimately, the best movers are the best players. Basketball movement is the ability to create space offensively and the ability to occupy space defensively. The athletes varied within each tactical situation within a well-defined range of acceptable joint angles, amplitudes, velocities and displacement of center of mass.
Basketball is a game of constant motion
Acceleration | deceleration | jumping
- Elite basketball players perform 20-24 accelerations > 3.5 m·s-2 per game.
- Elite basketball players perform 26-30 decelerations > 3.5 m·s-2 per game.
- Elite basketball players jump 45 times per game.
Acceleration | change of direction | jumping
- Basketball players will typically only accelerate the first three steps in transition, making the mechanics of these three steps vital.
- Players will have 9-12 change of direction tasks per minute of competition.
- Post players will, on average, perform more jumps than guards (49 to 41).
Acceleration | player contact | jumping
- Players accelerated faster with the basketball than without during games.
- Player-on-player contact is one of the more demanding tasks within the sport, so we should account for that when exploring the physical demands of games.
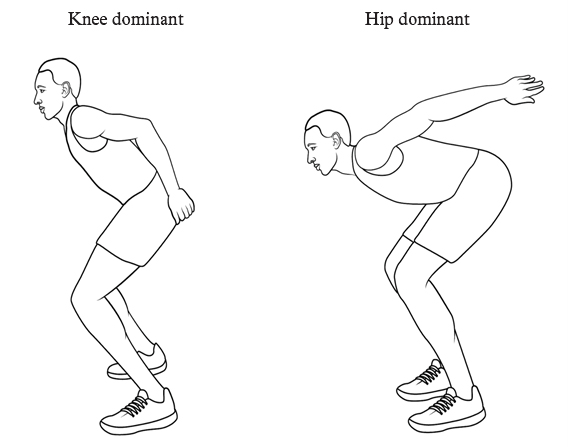
- Jump strategy will vary based on task. When blocking shots at the rim on defense, players will typically employ a shallow double-leg knee-dominant jumping strategy to increase rate of force development and decrease ground contact time. On the other hand, when attacking the basket on offense, players will use a single-leg takeoff with greater amplitude to increase impulse.
Building a training program for offensive transitions based on in situ observations
Basketball has linear, lateral, curvilinear and multidirectional components. When building this model of in situ evaluation, we understood at a descriptive level what our athletes do during competition. Now we had to determine how to apply this information in a training environment.
From a practitioner’s standpoint, we felt there were several components in general preparation that we could manipulate to optimize performance on-court. In our evaluation, we used transition offense and on-ball defense as proxies for evaluating linear and lateral mechanical development. On average, NBA players have 18-22 fast break transition opportunities and 14-26 ball-screen situations during competition. Therefore, we focused on those scenarios.
Transition offense is the most effective way to create easy scoring opportunities. Typically, transition is defined by a scoring opportunity within the first seven seconds of offensive possession.
Upon film review, basketball players only accelerate the first three steps during transition. After that, they typically have to decelerate to avoid contact with another player, stay in-bounds or take up a tactically advantageous position. A basketball court is 94 x 50 feet. Given these dimensions, athletes will rarely express their capabilities for max velocity in competition. Efficient acceleration is, therefore, extremely important.
Tweet This“The best movers are the best players”
Adam Petway
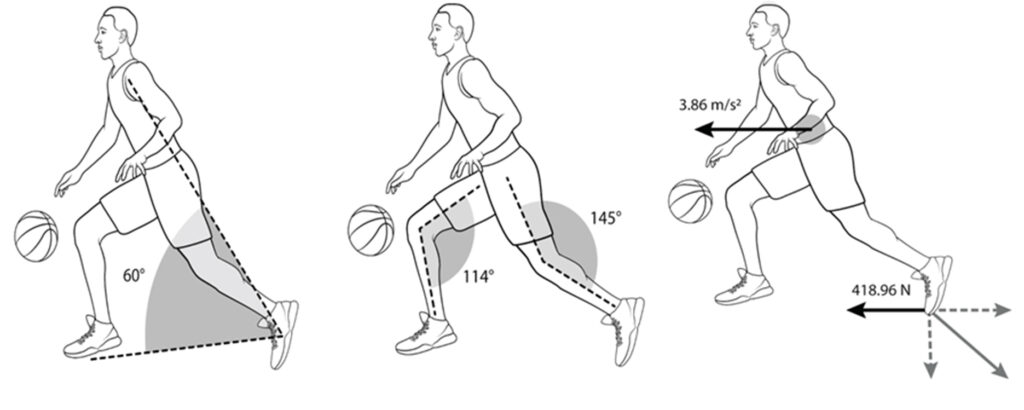
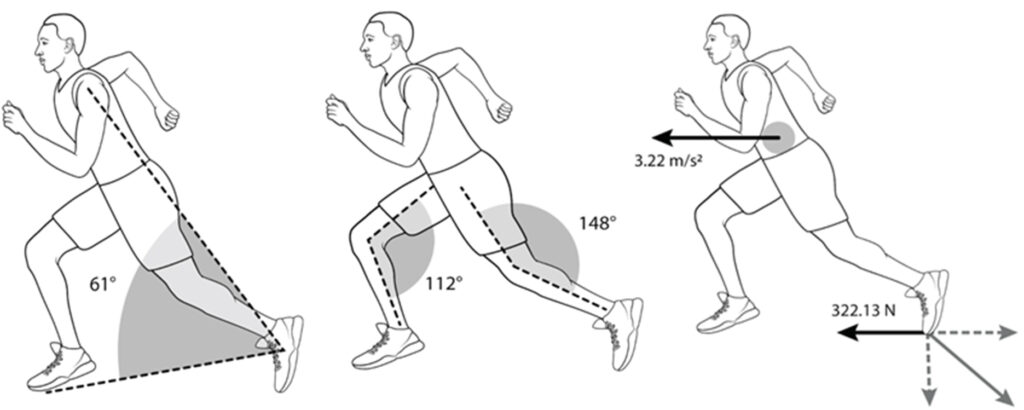
Accordingly, we modeled projection angles and acceleration mechanics for the first three steps in transition. We determined optimal horizontal velocities for the top performers in offensive transition based on the positive changes in velocity (acceleration) and the athlete’s body mass. Given mass x acceleration, we calculated the average horizontal ground reaction forces to be effective in transition basketball. We also noted that players in possession of the ball during transition move faster than the other players.
We could identify if the athletes’ transition deficiencies were kinetic or kinematic based on the information we had in our database.
From a kinematic standpoint, we assessed touchdown, midstance and propulsive angles; as well as front- vs. back-side mechanics when accelerating down the court. For kinetics, we examined the magnitude of horizontal ground reaction forces. We then differentiated between players with possession of the ball vs. those who did not have the ball. This led us to create a menu of interventions based on the deficiencies we found.


| Distance (meters) | Time | Mean velocity | Mass (kg) | |
| With ball | 18.78 | 3.13 | 6.00 | 98.54 |
| Without ball | 19.79 | 3.54 | 5.59 | 100.51 |
The distance and time were mean values from the start of transition until a player scored a basket.
It was interesting to note that the mean velocities were higher in players that had the ball in transition compared to the players that did not have the ball. This finding seemed paradoxical at first. However, upon film review, it made sense. After the first few steps in transition, the players without the ball rotate their trunks trying to locate the ball-handler for proper court spacing. The player with the ball can continue to accelerate for a longer duration as he dictates court spacing. We should also point out that, overall, faster players will typically have the ball in transition.
Projection angles
Projection angles are important during acceleration. If an athlete’s projection angle is too high, the athlete will not produce enough horizontal ground reaction force to translate forward. If the athlete projects too low, they will over-rotate and potentially fall. The optimal angle for projectile motion is 45 degrees, the equilibrium of both vertical and horizontal motion. However, due to the nature of basketball and the fact players will typically have to change direction to evade defenders and take a new position, the projection angles are steeper. Below are the average projection angles during the first three (propulsive) steps in transition.
| Projection angle at takeoff 1 | Projection angle at takeoff 2 | Projection angle at takeoff 3 | |
| With ball | 52.89 | 54.89 | 60.06 |
| Without ball | 56.68 | 58.90 | 61.27 |
Projection angles with the ball are lower than without. This is likely because meeting the ball at a lower angle is more economical and allows less of a chance for a defender to steal the ball.
Otherwise, these projection angles in basketball abide by basic physical and biomechanical principles. Notice that both groups – with and without the ball – increase the projection angle with each step. As angular velocity increases, the trunk becomes more upright as force production transitions from horizontal to vertical.
As we mentioned earlier, basketball players rarely reach top-end speed during games. Therefore, it is vital that our athletes are extremely competent within these first three steps of transition.
Horizontal force
The greatest athletes in the sport have the ability to produce the greatest magnitude of force in the least amount of time. Because acceleration is most important in the first three steps of transition, we modeled the horizontal velocity, acceleration and force of these steps for our best performers in transition.
Below is the horizontal acceleration for the second and third steps and ground reaction forces horizontally for the third step in transition.
| Avg. horizontal velocoty at step 2 (m/s) | Avg. horizontal velocoty at step 3 (m/s) | Avg. horizontal acceleration at step 2 (m/s) | Avg. horizontal acceleration at step 3 (m/s) | |
| With ball | 4.01 | 7.87 | 3.86 | 380.36 |
| Without ball | 3.93 | 7.15 | 3.22 | 322.13 |
In this model, the horizontal ground reaction forces represent the average force required to create the resultant horizontal velocities. These forces did not occur uniformly. At certain points during the ground contact, the players generated a greater magnitude of force in anticipation of propulsion. They also initiated braking forces upon ground contact, letting the center of mass translate horizontally over the distal segments.
This illustrates why it is important to understand that there are both braking and propulsive horizontal forces during these actions. When propulsive forces are greater than braking forces, the athlete is accelerating; and when propulsive forces are less than braking forces, the athlete is decelerating. Typically, the greatest rate of acceleration will be the first step out of a static position because the starting velocity is zero. However, we did not model this step because our athletes rarely begin court transitions from a static position.
Notice that horizontal velocity increases from step 2 to step 3, and the horizontal acceleration increases in step 3, thus increasing horizontal force.
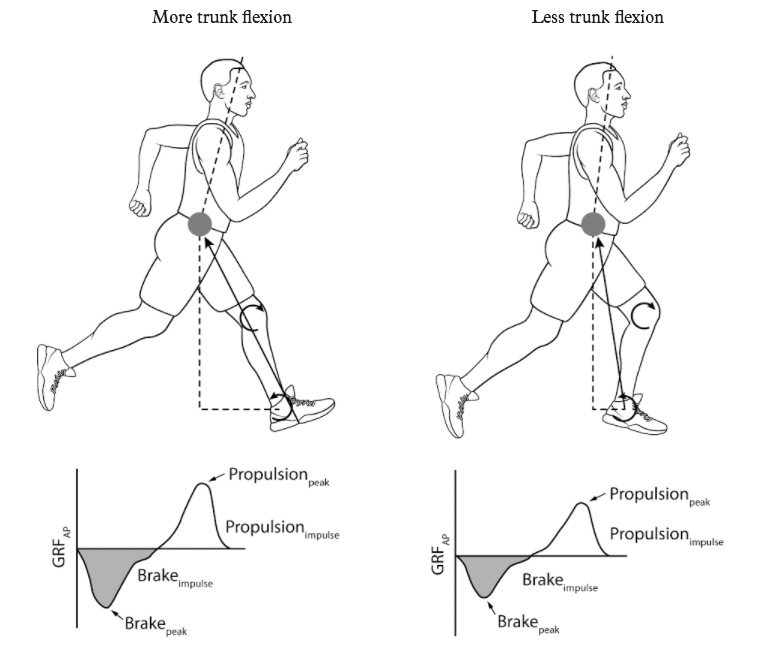
Programming for kinematic interventions
Athletes that project too low in transition and lack proper front side mechanics during acceleration often also show excessive trunk flexion and backside mechanics. Therefore, we prescribe a battery of general items at low angular velocity to address this aberrant movement.
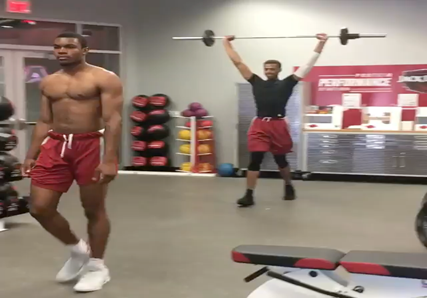
The first is the overhead walking march. We do this to enforce good posture and to address proper ground contact relative to the center of mass. We teach the athletes to be actively dorsiflexed prior to ground contact and have as much surface area of the foot in contact with the ground at midstance.
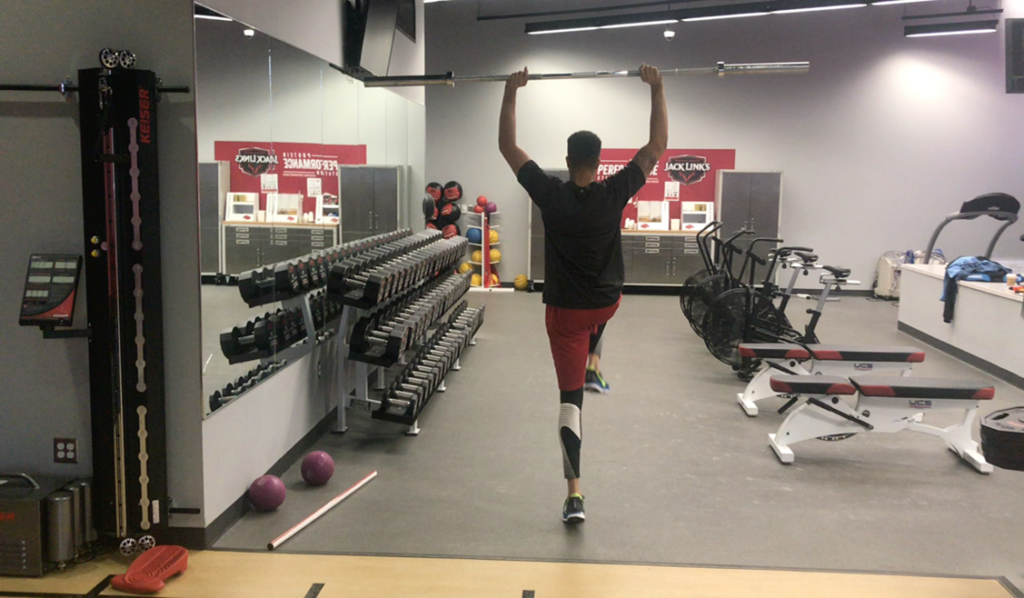
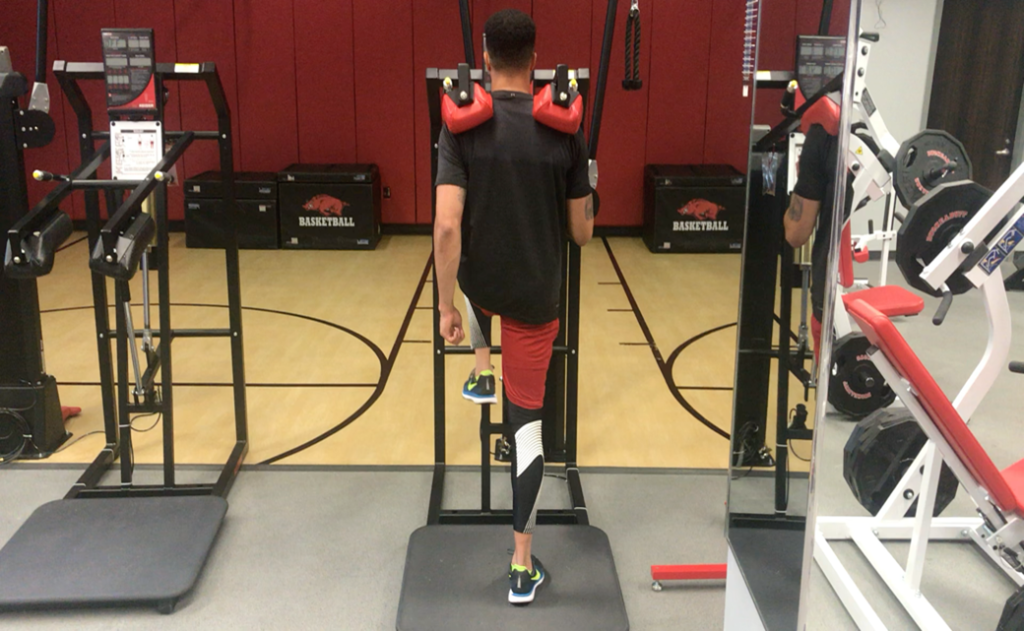
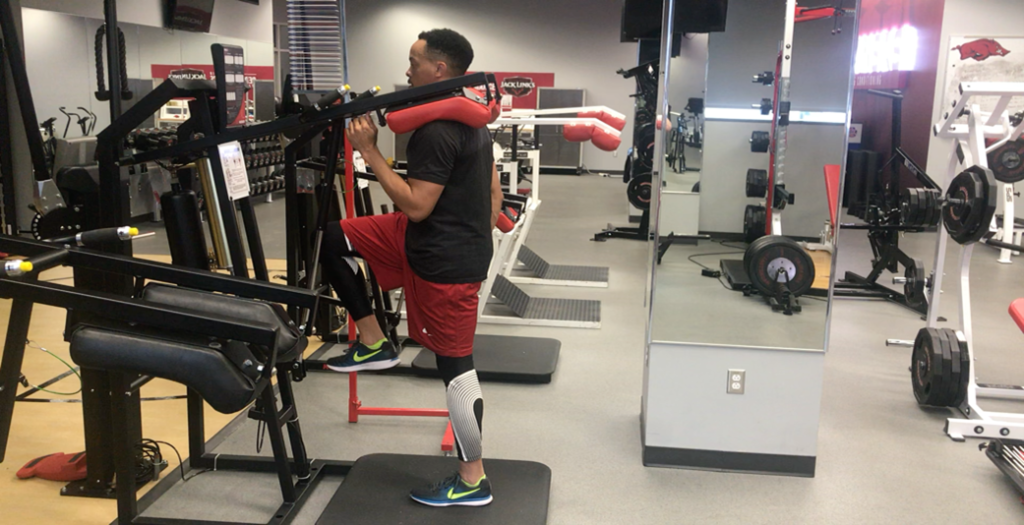
The next general exercise selection when we have identified faulty mechanics during transitional accelerations is thigh deflection isometric holds. We teach this with the athlete’s open thigh parallel with the ground, and coach them to keep a neutral pelvic position. The intent is to increase pelvic stability at midstance. We will typically use sets of 20-second isometric holds at 2x body weight on our squat machine. You can also perform these in an overcoming manner with catch pins and a barbell.
Programming to improve on-court kinetics
If athletes project too high in transition, they will not produce adequate horizontal force to efficiently accelerate down the court. To increase the magnitude of horizontal force production and improve propulsion during acceleration, we use resisted accelerations via sled pulls. We will typically use 10-15% body weight so angular velocity does not decrease too significantly. Considering that a basketball court is only 94 feet (28.6 meters), we will rarely exceed 30m for this exercise.
Addressing the physical demands of on-ball defense
Guarding the ball defensively is one of the more challenging tasks within the game of basketball. An athlete must possess the quickness to obstruct the ball handler from driving towards the basket, but also must express the strength to maintain position when absorbing contact from an opposing player. This can happen in ball-screen situations, where an offensive player will try to screen the defender guarding the ball to create space.
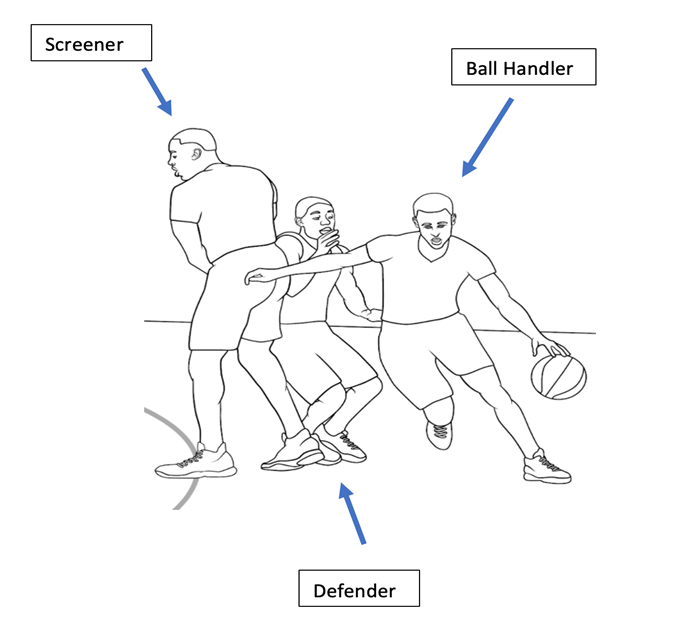
With this in mind we examined the optimal stance of a player in defensive ball screen situations; as well as the optimal lateral ground reactions forces to translate their center of mass in the frontal plane to obstruct the offensive player from driving towards the basket. We classified this by player position, separating the guards from the post players.
Upon film review, the magnitude of lateral ground reaction force and hip abduction velocity were determining factors for a player’s ability to displace his center of mass laterally in the frontal place.
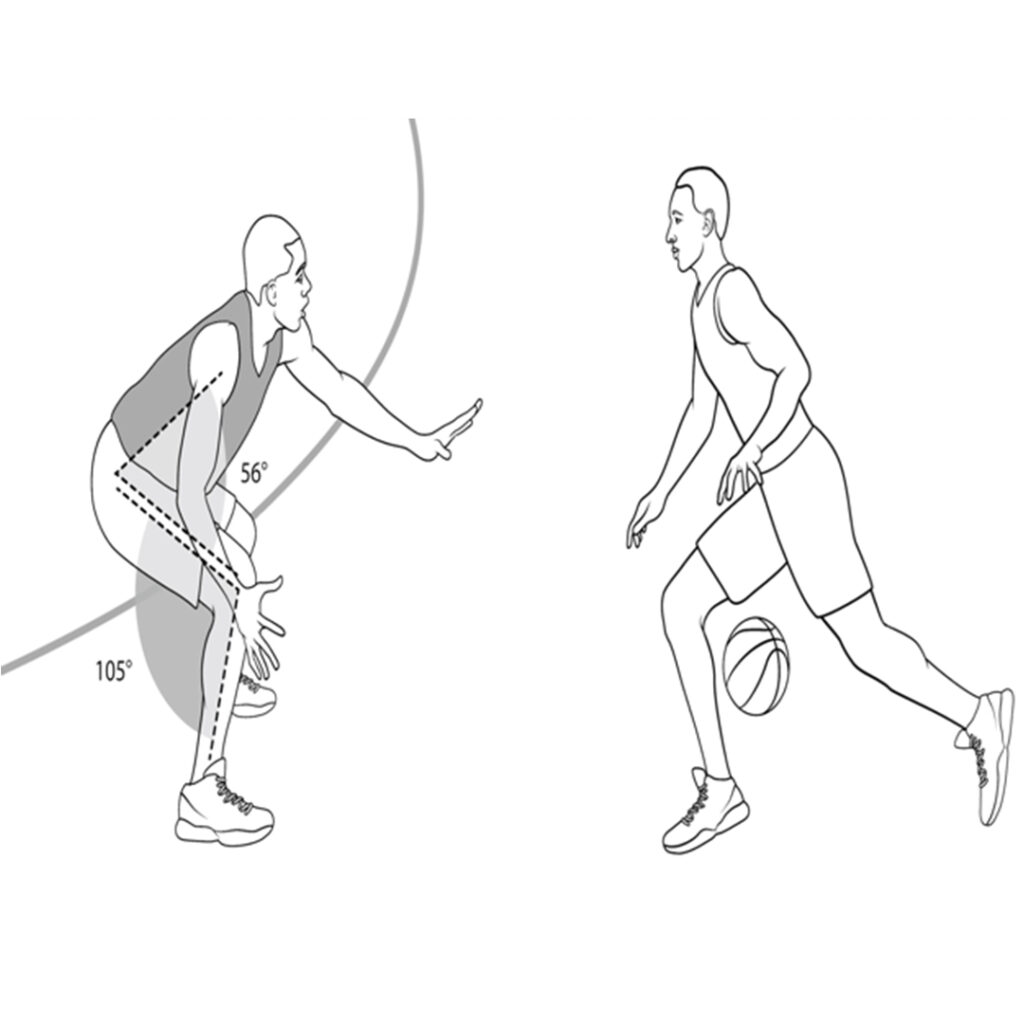
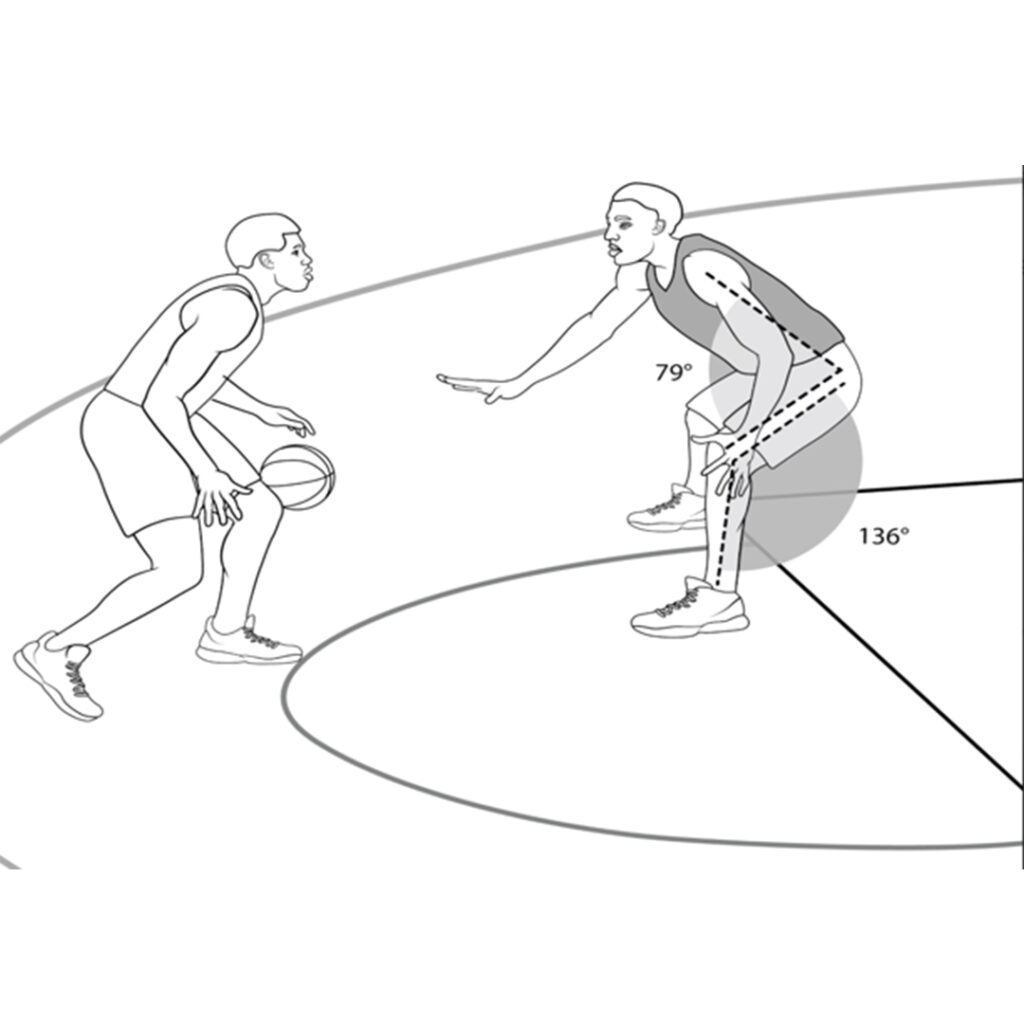
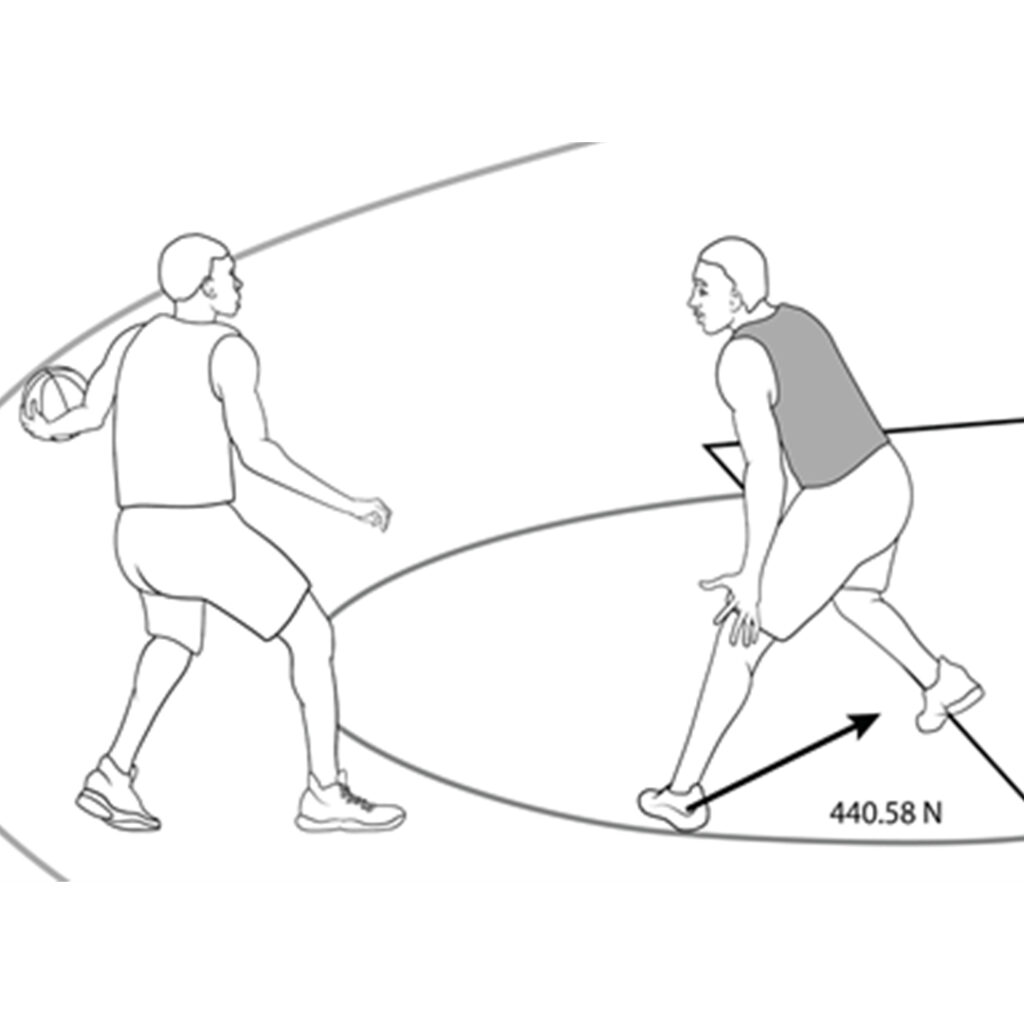
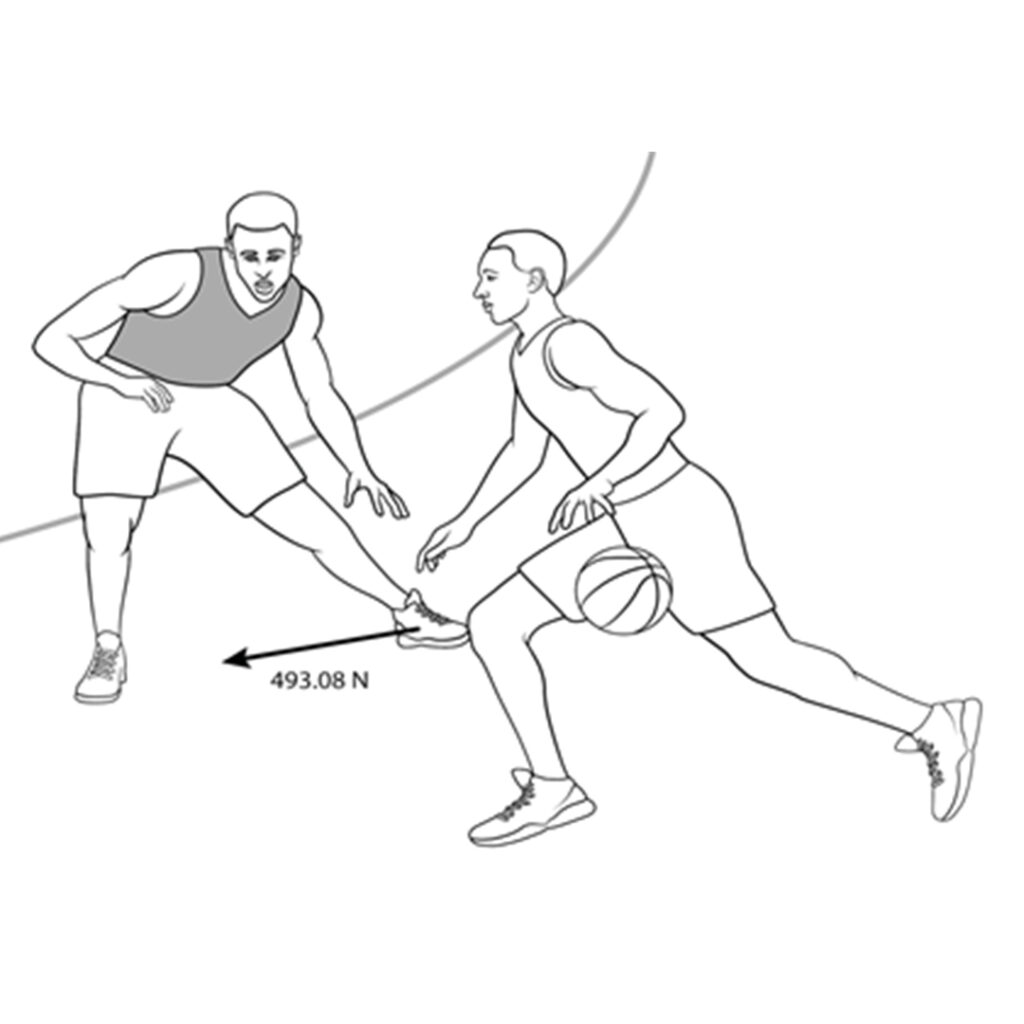
We again delineated kinetic and kinematic interventions based on the deficit relative to our database. A kinetic deficit was classified as an athlete not being able to apply the proper magnitude of lateral ground reaction forces to resist the opposing force of the screen. We defined a kinematic deficit, on the other hand, as an athlete lacking the necessary hip abduction velocity to translate his center of mass within the frontal plane.
To address the deficit for lateral ground reaction forces, we use lateral sled drags. This focuses on the player pushing his foot through the ground in the frontal plane to increase the magnitude and direction in which he applies force. Typically, we will use between 30-50% body weight for the resistance.
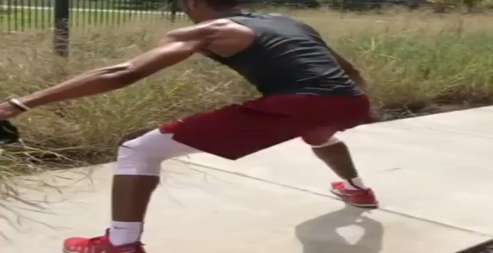
For hip abduction velocity, we program lateral leaps off a 12-inch box. This increases the hip abduction moment, as well as creates a longer flight time given the vertical component of the box. This helps develop this kinematic quality, with the ultimate objective of improving on-ball defense.

Training the wild tigers of the future
Closely watching and understanding wild tigers is crucial to getting the most out of caged tigers. That is, in-game evaluations provide context for an efficient means to determine application of a general stimulus in a controlled environment to ultimately improve performance during competition.
Using competitions as assessment allows a deeper insight into the best practices for helping our athletes.
Practitioners can not get the necessary information in a weight room / performance center environment alone. For example, we found that when in-game transitions were the basis for addressing kinetic and kinematic deficits in a general setting, we also induced an increase in peak speed during subsequent games. If we did not have this in-game diagnostic, we would not have been able to intervene to improve performance.
The in situ model, along with general evaluation, may allow practitioners to bridge the gap between these situations.
This project was not limited to just transition and ball-screen situations. We modeled 14 different tactical situations within the game of basketball. We identified the top performers in the world on offense and defense and evaluated the aggregate of physical attributes and movement expression from the group. We also compared anthropometric measures and performance metrics from the top performing players to the average from professional basketball in the United States. This information is extremely pertinent to performance coaches, strength & conditioning coaches, technical and tactical coaches within the sport. However, this concept can be applied to any sport and a broad range of athletic environments. The ultimate goal is to continue expanding on the model to help coaches and practitioners make sound decisions for optimizing performance.
*All imagines created by Elissa Sorojsrisom