

Original article written by Olli-Pekka Nuuttila, Santtu Seipäjärvi, Heikki Kyröläinen and colleagues
Background
Heart Rate Variability (HRV) has become a popular metric for day-to-day monitoring of athlete stress, recovery, and preparedness to train or compete. Indeed, recent evidence suggests we can fine-tune training prescription for long-term adaptation based on fluctuations in an individual’s HRV data compared with their typical baseline values [1].
Improvements in technology have flooded the market with measurement options for monitoring HRV, creating a bit of confusion around how to best interpret the output from different methods and devices. One of the most common questions concerns the differences between HRV measured passively through the night (as per popular wearable sensors, such as Whoop, Garmin, Oura) and HRV measured first thing in the morning (as per many research studies and encouraged by popular apps such as HRV4Training).
So, are there important nuances between nocturnal and morning HRV measurements that practitioners should be aware of when using these data to inform daily athlete monitoring and training decisions?
What the authors did
Compared the reliability and sensitivity of 3 different sampling periods for calculating HRV in a group of recreational male and female runners (6 ± 2 training hours per week).
ECG data were captured via a Firstbeat Bodyguard 2 device. HRV indices (LnRMSSD and LnHF) were calculated using Kubios HRV Premium Software. Outputs were then compared for 2 consecutive nights after 2 different conditions:
- Identical low-intensity interval sessions (Duration: ~85 mins, RPE: ~3/10; n=15)
- A rest day and a maximal 3000-m running test (n=23)
The 3 methods for measuring nocturnal HRV differed in their sampling periods:
- Full night of data
- 4–hour period starting 30 mins after going to sleep
- Morning value (the end point of a straight line drawn between each 5-minute average within full-night data)
What the authors found
HRV indices showed good reliability (ICC > 0.90, CV < 4%) between nights following the low intensity exercise.
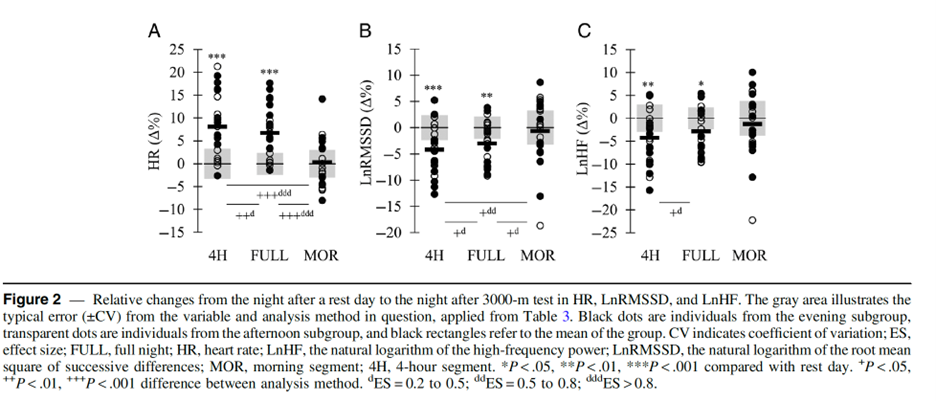
Some interesting nuances were also detected between the different methods of nocturnal HRV measurement after the 3000-m maximal exercise test. LnRMSSD and LnHF decreased compared with the previous night when HRV was sampled over the full night and over the 4-h period, but not for the morning value (Figure 2). The size of the decrease in LnRMSSD was also greater for the 4-h sample than for the other two methods.
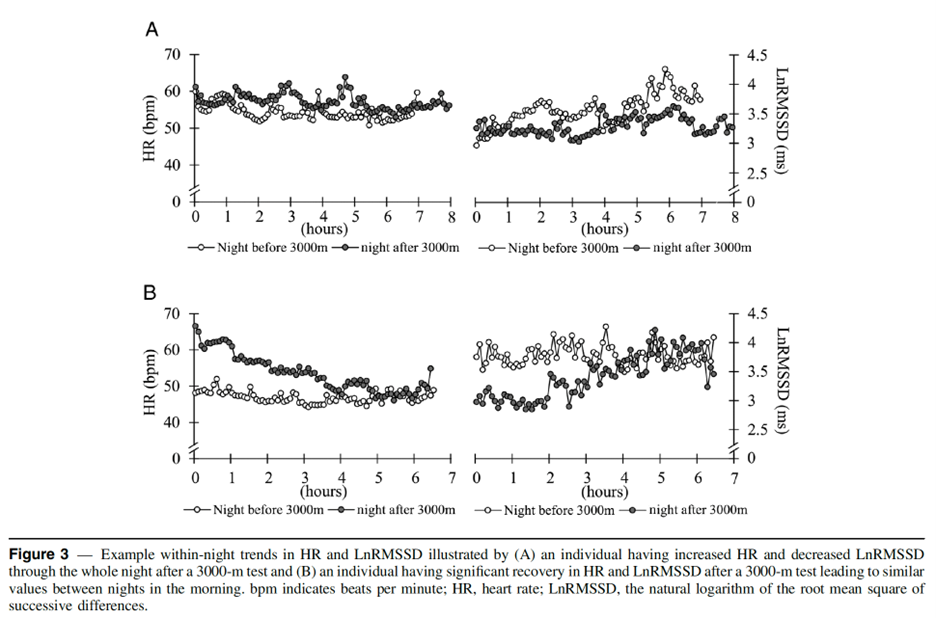
Interesting variation between individuals was also reported (Figure 3). Participant A shows suppressed HRV throughout the entire night following the 3000-m run, whereas Participant B experiences initial suppression with quicker re-normalization after ~4 hours.
For Participant A, nocturnal and morning HRV values will therefore be fairly similar, whereas nocturnal values (from the 4-h method especially) will be meaningfully lower than morning values for Participant B, potentially providing a misleading indication of their physiological status by morning time.
Limitations
It’s unclear from this study which variables may account for apparent individual differences in HRV recovery patterns following maximal exercise. There weren’t enough participants to look at things like sex differences, including potential effects of menstrual cycle phase, or training status, considering participants were recreational athletes.
While this study used well-validated devices to measure HRV, the method of calculating morning HRV does differ somewhat from how many athletes monitor their morning HRV (self-recording a 1-5 min sample upon waking, either supine or standing), which may also affect real-world application of these findings.
What this means for coaches
Approaches calculating HRV across an entire night, or early periods of the night (i.e., Garmin, Oura, Whoop) may best reflect the physiological and psychological load of the previous day. On the other hand, morning readings (i.e., active sampling through apps like HRV4Training) may better reflect an athlete’s state of recovery and/or readiness to perform the next day.
Different athletes will likely experience different HRV recovery kinetics in response to similar training session, so taking an individualized approach to monitoring and prescription is likely also key.
If you have access to continuous nocturnal data (like the plots in Figure 3), taking the time to eyeball and/or analyze it for trends may also reveal more useful information than simply looking at one summarized HRV value (an average nightly LnRMSSD score, for example).
Reviewer’s comments
Not all HRV values from different devices and app algorithms are created equal. The different sampling periods investigated in this study are just one example of some of the nuances to be aware of when collecting and interpreting HRV data with athletes. The articles below provide some helpful and detailed discussion of many of the things that are important to consider from a practical perspective.
Whichever device you’re using, it’s worth doing some digging under the hood to understand how they’re calculating HRV, and what the knock-on effects might be for making daily training and recovery decisions.
Recommended resources
Article – Thoughts on heart rate variability (HRV) measurement timing: morning or night? – Marco Altini
Article – Sleep duration and nocturnal vs. standing HRV recovery from COVID – Andrew Flatt