
The use of wearable technology in college and professional sports continues to increase in popularity. Most wearable systems track variables related to biomechanical stress (external load) or physiological stress (internal load), and some companies have developed products capable of both, such as integrating accelerometry and electromyography (EMG) technology in one wearable device. This combination can paint a comprehensive movement picture for its users.
Surface EMG’s value as a wearable technology
Clinical practitioners have been using EMG since the early 1900s to study muscle activation and specific muscle disorders. As EMG electrodes improved into the 1980s, data collection became easier and more efficient, making EMG valuable for research in biomechanics, physical therapy and neuromuscular physiology.
The demand to evaluate more dynamic movements using EMG drove the increased usage of surface electromyography (sEMG). sEMG provides a non-invasive way to monitor fatigue during static and dynamic movements, gives real time analysis of the muscle groups in question, and provides correlations with biochemical and physiological changes in the muscles during movement performance.
sEMG has its limitations, but has proven its value for evaluating internal metrics during performance.
One constraint on any sEMG device is the need to cover a large surface area on the athlete in order to detect the activity of multiple muscle groups, or even just one large muscle. An armband will not suffice.
Integrating sEMG sensors into the compression shorts that athletes wear during training and competition is one solution. It’s non-invasive and non-interfering, and since many athletes already wear compression garments during training or match play, it’s not adding anything to their usual routine. Practitioners can therefore assess muscle function during dynamic movements, optimize performance during training and quantify movement strategies in natural settings, in real time.

Understanding sEMG output in sporting contexts
sEMG provides a unique internal metric that other wearable technologies do not match. Using sEMG, practitioners can gain information on muscle activation distribution across the quads, glutes and hamstrings as well as right to left leg symmetry, for example. Being able to see the muscle over the duration of movement gives insights into how the athletes’ movements could predispose them to injury due to factors like asymmetry or muscle activation distribution. It also can provide a fatigue metric as we look at activation frequencies and amplitudes.


Context is key when looking at sEMG results. Figures 2 and 3 show two different views of sEMG during a training session. Figure 2 gives the averages of the entire session and Figure 3 shows how those muscle ratios change over the course of the session. As leg symmetry and activation ratios change, we can start to develop an understanding of what is happening internally with each athlete.
Often, we see a shift in muscle distribution that can contribute to fatigue. A decrease in percent activation or an increase in a particular muscle group could be an indicator of fatigue. The increase could show that the muscle group needs to work harder in order to complete the same task, while a decrease might reveal that the muscle group no longer has the capacity to perform the task.
Changes in muscle ratio could also be a result of down regulation in one muscle group followed by up regulation in another. This compensation pattern is often seen within the leg symmetry metric and could be an indication of injury, imminent injury or an athlete attempting to avoid movements that cause them pain.

This snapshot provides trend information on leg symmetry and muscle ratio, as well as external load (EL) and muscle load (ML). These provide context on the athlete’s performance and if the athlete is experiencing movement issues that are a result of injury or could result in an injury.
Injuries are obviously unpredictable, but the unique internal metrics from sEMG monitoring gives us valuable movement information that other wearable systems do not. Understanding these metrics enables practitioners to investigate and uncover issues sooner, as well as improve the athletes’ return from injury.
Tweet ThisUnlike heart rate monitors, that provide internal view into how the athlete is responding to training, sEMG gives us greater understanding of the internal effects of training directly at the muscle level
Logan Ogden
External load and muscle load
Combining the quantitative measurements of an athlete’s movements via a connected accelerometer can generate an external load metric (EL). This can be valuable when trying to understand the intensity of a session (i.e., EL / minute) and when working with the team coaches to periodize the weekly practice schedule.
Similarly, aggregating the sEMG data produces a muscle load or internal load metric (ML). Overlaying the ML with the EL lets us make some conclusions on how efficiently the athlete is performing a training session, and is valuable in the return to play process.
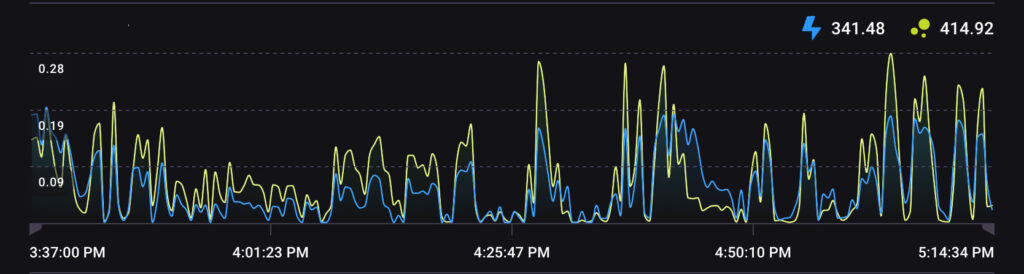
Figure 5 shows EL and ML data during a practice session for a healthy, trained athlete. The two data streams follow closely together, indicating that the athlete is very efficient. Figure 6 shows data from a different athlete during the same training session. This athlete does not appear as efficient. ML is significantly elevated compared to EL, suggesting that this athlete uses greater muscle activation to perform similar tasks.
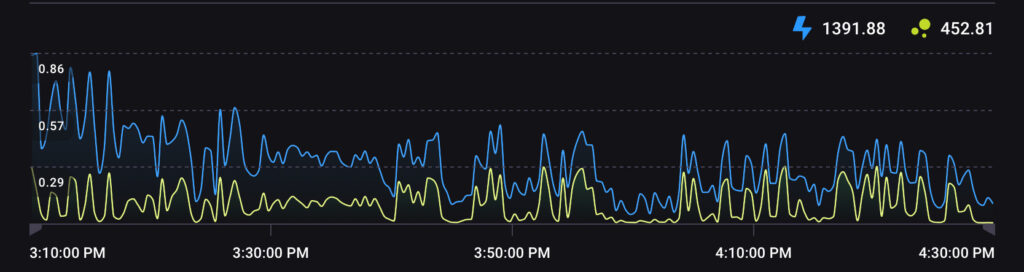
Again, context is key when looking at the data, but we can begin to ask ourselves questions about the status of the athlete. Are the ML/EL discrepancies due to fatigue? Is that fatigue a result of overtraining or poor recovery? Maybe the change in ML/EL has been gradual over weeks as the athlete has detrained from lack of playing time or overtrained from excessive training volume or intensity.
The combination of accelerometry and sEMG gives practitioners a much more comprehensive picture of the demands an athlete confronts during a training session.
Even so, EL alone has been vital to how we plan our daily training. We examine daily and weekly EL values as well as EL/min. EL represents the actions each athlete performs, and EL/min is how much load the athlete accumulates over time, quantifying the intensity of the session. Just as strength & conditioning coaches plan blocks of training, with this data our basketball coaches can better plan blocks of practice. External load measures inform how we undulate volume and intensity day to day, how we train and practice after a vacation period, and how we build a week leading into a game. Figure 7 is an ideal representation of a weekly build leading into a competition, what we call a “Game Build.” The red bars represent EL (volume) and the black line represents EL/min (intensity).

• High volume
• Medium intensity (MD-2)
• Medium volume
• High intensity (MD-1)
• Low volume
• Medium / high intensity (MD)
We adjust our weeks as appropriate but, overall, we have found that this type of weekly undulation has been successful for athlete load management and recovery.
Tweet ThisInjuries are obviously unpredictable, but the unique internal metrics we observe with sEMG does give us valuable movement information that other wearable systems do not
Logan Ogden
Combining sEMG with movement analysis
The figures below show a movement evaluation of an athlete performing sprints during a tempo conditioning session. During the session, the athlete would sprint diagonally across the football field from end line corner to end line corner in approximately 15 seconds. The athlete then has 45 seconds to walk the end line to the opposite corner before performing another sprint. Everything in the evaluation looks normal for his first sprint. He has appropriate amplitudes in all muscle groups as well as appropriate muscle activation ratios (Figure 8).
But as the session continues, we notice dramatic changes.
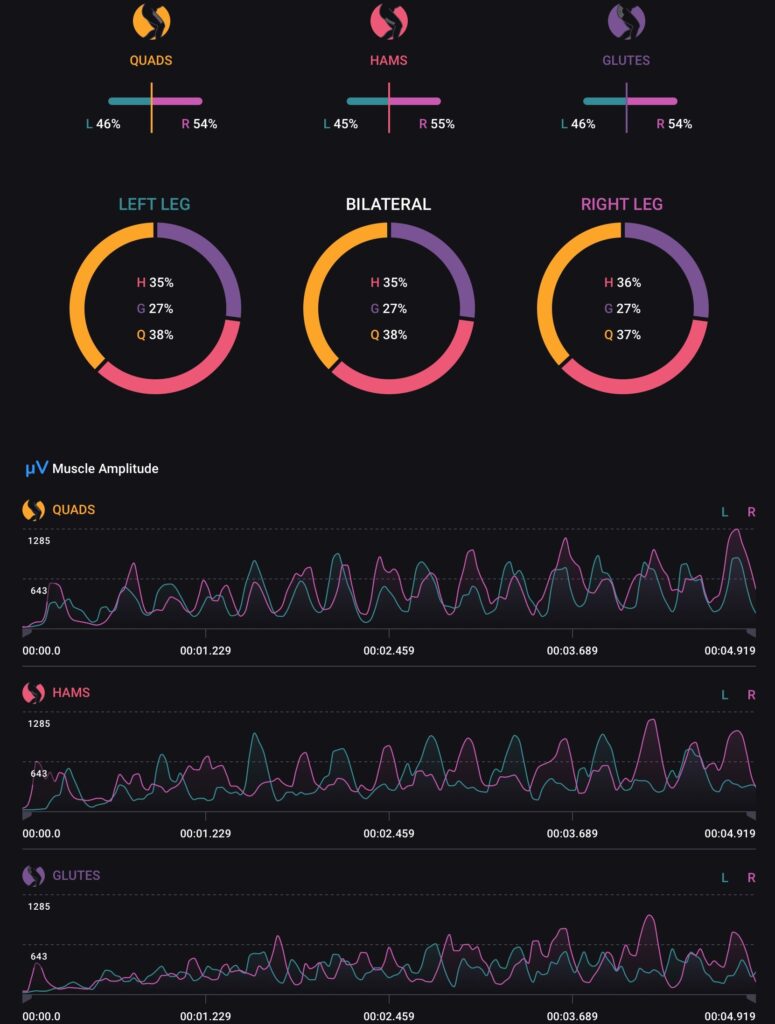
The next figure comes from approximately halfway through the session. We are beginning to observe that the athlete is relying increasingly heavily on the quads to perform the sprint, and compensation patterns are developing within the hamstrings and glutes. The left hamstring and right glute are starting to show higher amplitudes than their counterparts.
Furthermore, all amplitudes have dropped significantly from the early parts of the session. Amplitudes go from 1285 uV to 915 uV in the quads and around 500 uV in the glutes and hamstrings. Muscle activation is decreasing, potentially due to decreased nutrient availability or an increase in lactate concentration. These conclusions make sense knowing that this is a conditioning session early in the off season.
The final output is the athlete’s last sprint of the session. Amplitudes are approximately the same, but the athlete is now completely reliant on the quads to perform the task. The combination of the muscle compensation patterns as well as the decreased amplitudes indicate a significant amount of fatigue as the athlete completes the session. Our coach’s eye can confirm the data we receive from sEMG. We start to see shorter stride length and decreased stride frequency as the athlete completes the session. We can also see changes in the athlete’s running posture, as they appear to be less efficient during the movement. While we can visually interpret the changes the athlete is experiencing, sEMG analysis gives us a much more detailed picture of how the athlete is performing.


This data can play a major role in how we periodize our training sessions and give us a better understanding of an individual athlete’s work capacity. And it’s useful feedback for the athlete so we can show them what we are seeing, talk through the necessary movement improvements and give them training goals.
Tweet ThisWe use sEMG wearable technology daily to track the progress of our athletes, mitigate injury, periodize and optimize our training, and assist our amazing sports performance staff during RTP protocols
Logan Ogden
Role of sEMG in return to play
We use sEMG during the RTP process to investigate compensation patterns and movement strategies that mark the athlete’s progress and the effectiveness of our training and rehabilitation.
The following example highlights an athlete with a left lower leg injury. In Figure 11, this athlete is performing a rear foot elevated split squat (RFESS). The first five reps are with the left leg forward and the latter five reps are with the right leg forward.
With his left (rehabbing) leg, we see decent activation of the quad and hamstring. The right leg plays a minimal role, as this is an isolation exercise. As he shifts to his right leg, the left leg is a significant part of the movement strategy at every muscle group.
This raises some red flags, given the athlete’s injury history. Is this compensation pattern a result of a previous injury? Does the athlete experience pain or weakness in that limb? Is this compensation pattern cause for concern as we proceed though the RTP process?

Watching the athlete perform the movement live, it is hard to detect the compensation pattern with the naked eye. Each leg seemed to perform the movement the same. The athlete completes the movement pain free, and I cannot detect a difference in movement strategies between each side.
The difference between what the coach’s eye can see and what sEMG reveals highlights the effectiveness of sEMG to provide more information about how an athlete moves. Subtle compensations that athletes naturally make can be detected early and potentially prevent issues in the future.
We then explored basketball specific movements and sprinting to see if the compensation pattern still persisted. We discovered that it was even more pronounced.
Figure 12 is from when the athlete is performing a standing shooting drill. This drill is specific to his position and is continuous in nature. He has little right quad (healthy limb) activation and compensates with his right glute to perform the task. Again, this is very hard – if not impossible – to detect via coach’s eye.

The same patterns of low right leg amplitudes and high left leg amplitudes emerge when the athlete is running. After further communication with the athlete and sports performance staff, we discovered that a previous injury on his right leg was still causing complications with training. The athlete also tended to have more pain and swelling in the right leg than the left. Is this due to poor activation? Is the athlete still uncomfortable using his right leg? Has there been a separate injury to the right leg?

We began RTP protocols for both limbs. The left limb continued according to physical therapy and athletic training protocols, while for his right limb we started to explore isometric training to improve his muscle activation and force production. In parallel, the athlete worked with the athletic training staff to improve structural integrity and prevent swelling and pain flare ups.
We began to see improvements, but the athlete still displayed significant compensation patterns, and experienced discomfort and inflammation post-training. Further evaluation and imaging by the medical team drew our attention to additional damage that we needed to address. Finally, with all these pieces in place, the athlete began to progress much faster and showed increased efficiency within his movement.
Using sEMG ignited these additional questions about the athlete’s health, which ultimately led to a solution. Because sEMG was in place early in the RTP process, we could stay on schedule to meet the athlete’s goals and benchmarks. No amount of training or rehab could have “fixed” this issue without sEMG’s unique contribution to our knowledge base.
Tweet ThisWhen watching a movement live, it is hard to detect any compensation pattern with the naked eye. This highlights the effectiveness of sEMG and its ability to provide a more detailed view of how an athlete moves
Logan Ogden